Opening Range Breakout: What 142,348 Trades Actually Show
The opening range breakout is roughly a breakeven strategy. Not a losing one, not a printing press. Breakeven.
We ran the classic five-minute ORB across 142,348 simulated trades on 104 liquid US stocks and ETFs, from January 2020 through August 2026, and it produced a profit factor of 1.03 and an average of about +0.011R per trade. That is a coin flip that pays for itself and very little more. Then we did something almost no published ORB study does: instead of assuming your order fills at the breakout level, we pulled one-second bars around 3,106 real breakout triggers and measured where a stop order actually fills. That single assumption — the fill — accounts for roughly 29 cents of every dollar of edge you see quoted in a typical ORB backtest.
What follows is where the edge is (long side, gap-aligned, single stocks), where it isn't (shorts, SPY, "best day of the week"), and how much of the published version of this strategy is an artefact of how the test was built rather than how the market behaves.
The strategy, exactly as tested
"ORB" means different things to different traders, so here is the specification, pinned down to the letter. If you want to rebuild it and check us, this is enough to do it.
- Opening range: the high and low of the first five minutes of the regular session, 09:30–09:34:59 ET.
- Entry: the first touch beyond either edge of that range after 09:35 — long above the high, short below the low. This is a resting stop-order model, not a close-above-the-range confirmation. One trade per symbol per day. No new entries after 15:49 ET.
- Fill: the conservative arm fills at the open of the bar after the trigger bar, on the principle that you cannot act on a bar until it has completed. A second arm fills at the level itself, which is what most published studies assume. The gap between those two arms is the subject of the fill measurement below.
- Stop: the opposite edge of the range. Risk (1R) is therefore one full range width.
- Targets: half off at 0.5× the range beyond the edge, the remainder at 1.0×. When a stop and a target are both touchable inside the same bar, the stop wins — the conservative resolution.
- End of day: anything still open is flattened at 15:49 ET. Nothing is held overnight.
- Costs: zero commission, which is realistic for US retail equities, and no slippage beyond the fill rule itself. No borrow fees on shorts.
Results are expressed in R — multiples of the risk taken on that trade — so a $400 stock cannot dominate a $40 one. Universe: 104 liquid large-caps and ETFs, 144,067 symbol-days, exchange (SIP) one-minute bars.
The headline: a coin flip that pays for itself
| Configuration | Trades | Win rate | Profit factor | Avg R / trade |
|---|---|---|---|---|
| 5-min ORB, conservative fills (canonical) | 142,348 | 53.9% | 1.031 | +0.011 |
| 5-min ORB, fills at the level | 142,375 | 53.8% | 1.066 | +0.023 |
| 5-min ORB + 5% penetration buffer | 141,992 | 56.0% | 1.033 | +0.011 |
| 5-min ORB + minimum-range filter (0.3% of price) | 138,896 | 54.0% | 1.022 | +0.008 |
| 15-min ORB, conservative fills | 140,369 | 55.3% | 1.034 | +0.010 |
| 30-min ORB, conservative fills | 135,721 | 55.1% | 1.033 | +0.009 |
These results are based on simulated or hypothetical performance results that have certain inherent limitations. Unlike the results shown in an actual performance record, these results do not represent actual trading. Also, because these trades have not actually been executed, these results may have under- or over-compensated for the impact, if any, of certain market factors, such as lack of liquidity. Simulated or hypothetical trading programs in general are also subject to the fact that they are designed with the benefit of hindsight. No representation is being made that any account will or is likely to achieve profits or losses similar to those shown.
Read the last column, not the win-rate column. Every genuine variant of the strategy lands in the same narrow band of roughly +0.008R to +0.011R per trade. The only row that moves materially — the level-fill row at +0.023R — does not change the strategy at all. It changes an assumption about your broker.
To make the scale concrete once: a trader risking a fixed $100 per trade is netting on the order of a dollar or two per trade before commissions. A tick of friction per side erases it. That is the honest size of this edge, and it is why ORB reads so well in articles and so badly in account statements.
The fill tax, measured rather than assumed
Nearly every ORB backtest you can find online — including the ones with equity curves and screenshots — assumes your order fills at the breakout level. The price crosses; you are in, at that price, for free.
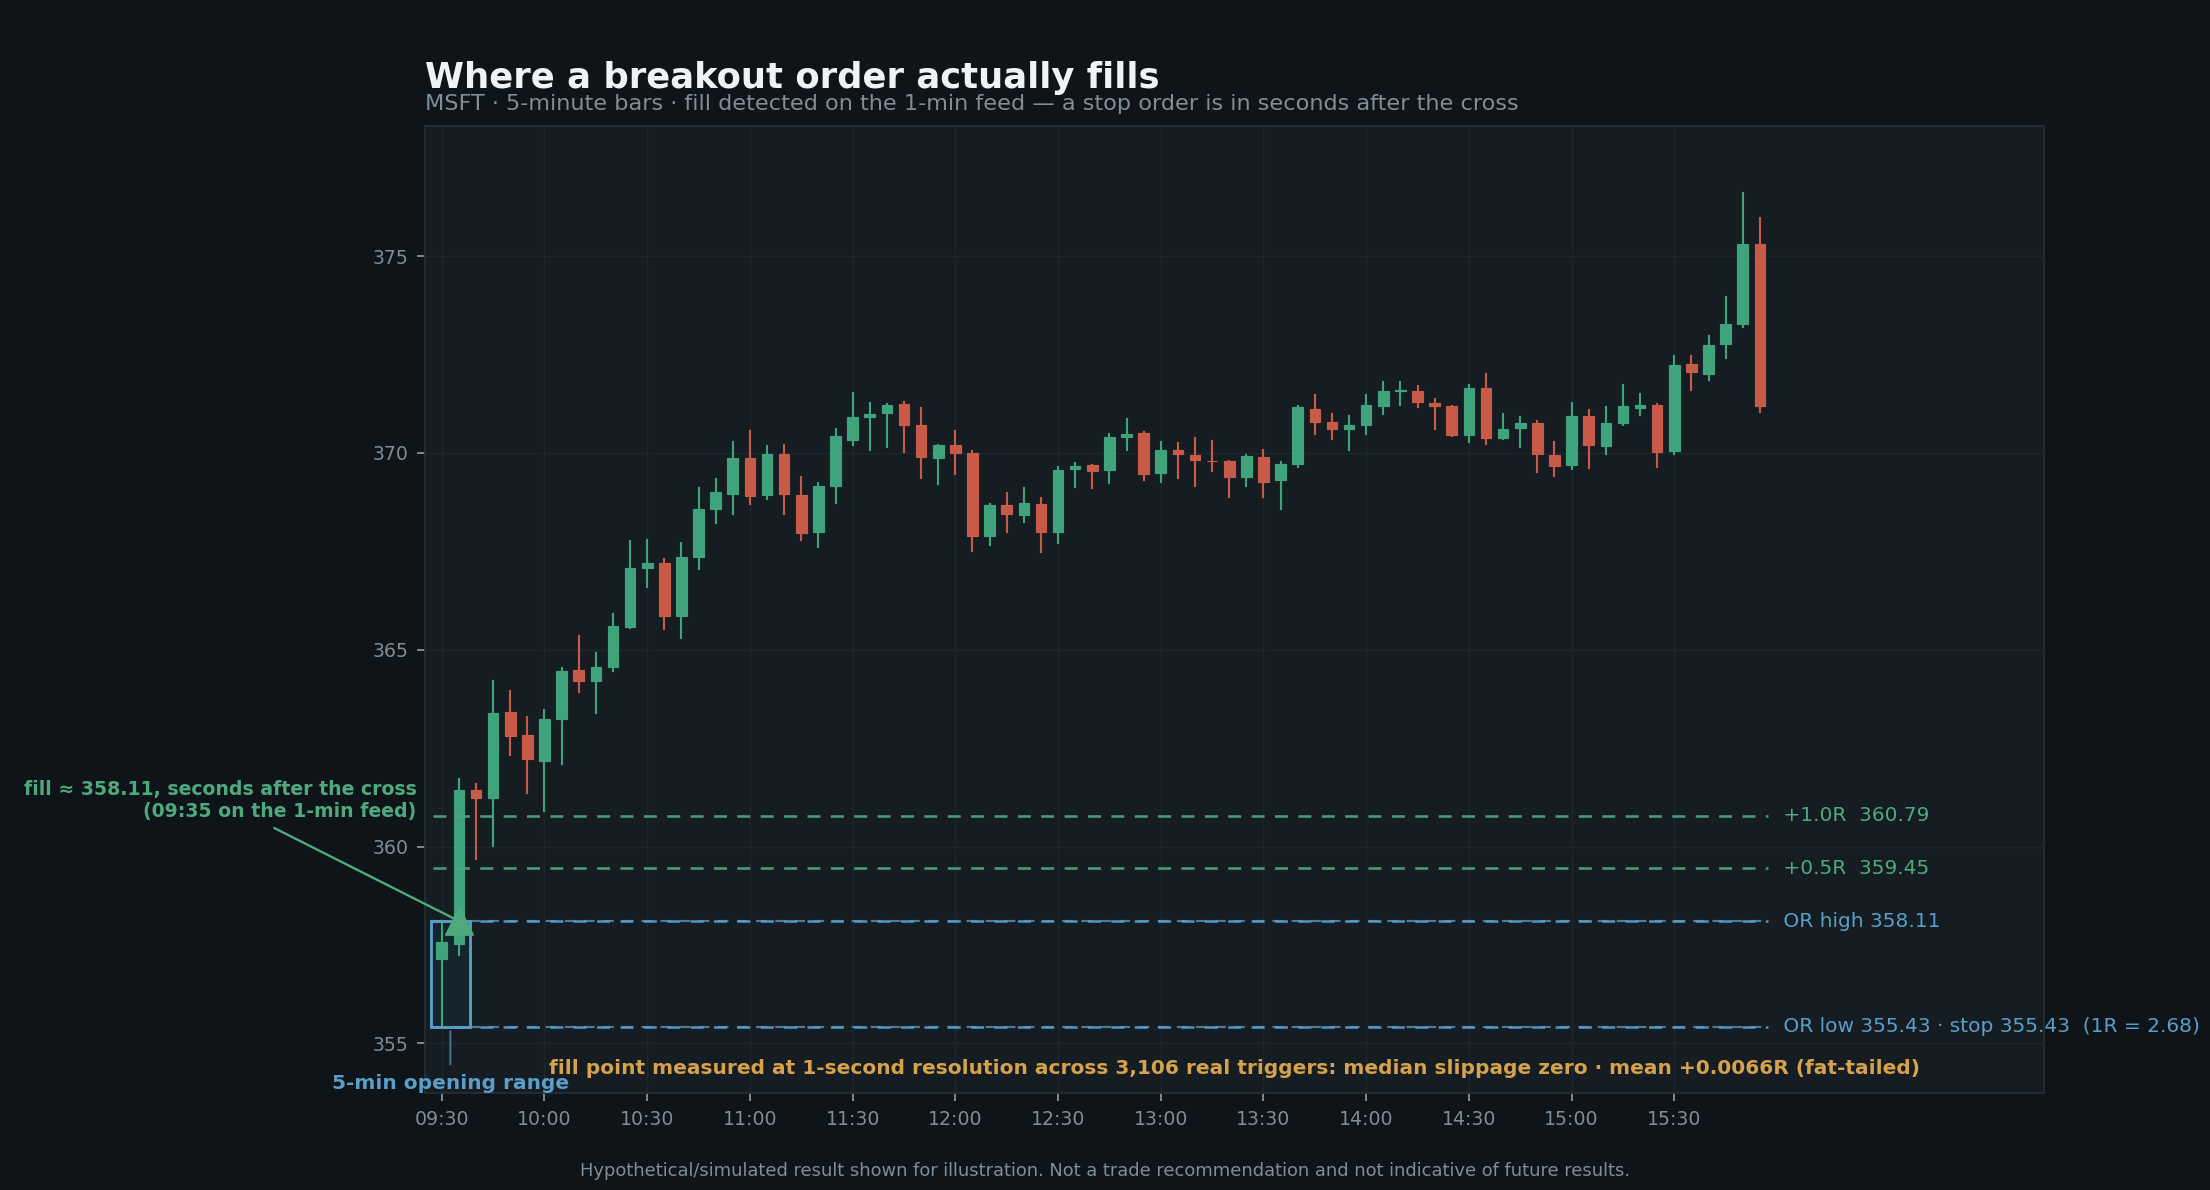
Rather than argue about whether that is fair, we measured it.
Method: take a stratified random sample of 3,150 real triggers from the trade log, roughly 450 per year across 2020–2026. For each one, fetch the one-second bars around the trigger window. Find the first one-second bar whose price crosses the level. Fill at the close of the next one-second bar — which is within a second or two of how a live stop-market order actually behaves. Of the 3,150 sampled triggers, 3,106 were measured, a coverage rate of 98.8%; a handful of rows were dropped as vendor price-basis artefacts.
| Measured quantity (n = 3,106 fills) | Value |
|---|---|
| Median slippage versus the breakout level | 0.00 — the median fill is the level |
| Fills at or better than the level | 50.2% |
| Mean slippage | +0.0066R ± 0.0017 (about 1.2 bps of price) |
| 95th-percentile slippage (the fast breaks) | +0.13R (10+ bps) |
| Median time from range break to the cross | 8 seconds into the trigger minute |
Now apply that measured cost to the level-fill result:
| Fill model | Avg R / trade | Basis |
|---|---|---|
| At the level | +0.0226 | Simulated, zero slippage |
| Measured one-second fills | about +0.0160 | 3,106 fills, measured |
| Open of the next one-minute bar | +0.0109 | Simulated, acts only on completed bars |
Roughly 29 cents of every dollar of apparent edge in a level-fill ORB backtest is the fill assumption, not the strategy.
But the shape of that cost is the part worth sitting with, because it is counter-intuitive and it generalises well beyond ORB.
The median slippage is zero. Half of all breakout fills land at or better than the level. Keep a trading log and most of your entries will look clean, and you will reasonably conclude that slippage is not your problem. The cost does not live in the middle of the distribution. It lives in the tail: the 95th percentile fill costs +0.13R, because in the roughly two seconds between the price crossing your level and your order executing, the market has run ten basis points or more away from you.
And which breakouts run ten basis points in two seconds? The fast ones. The violent ones. The ones with real momentum behind them — which is precisely the trade you were trying to buy when you put a stop order above the opening range in the first place.
That is the structural point. A momentum entry pays its worst slippage on its best signals. The tax is not a random friction sprinkled evenly across your trades; it is levied selectively on exactly the trades whose character you were selecting for. Mean-reversion entries, which buy into supply, largely do not pay it. Momentum entries pay it by construction, and no amount of parameter tuning removes it, because it is not a parameter — it is what the order type does.
The edge is long-side and gap-aligned
If a thin edge exists at all, it is worth knowing where it concentrates. It concentrates in two places, and they compound.
| Side | Trades | Win rate | Profit factor | Avg R |
|---|---|---|---|---|
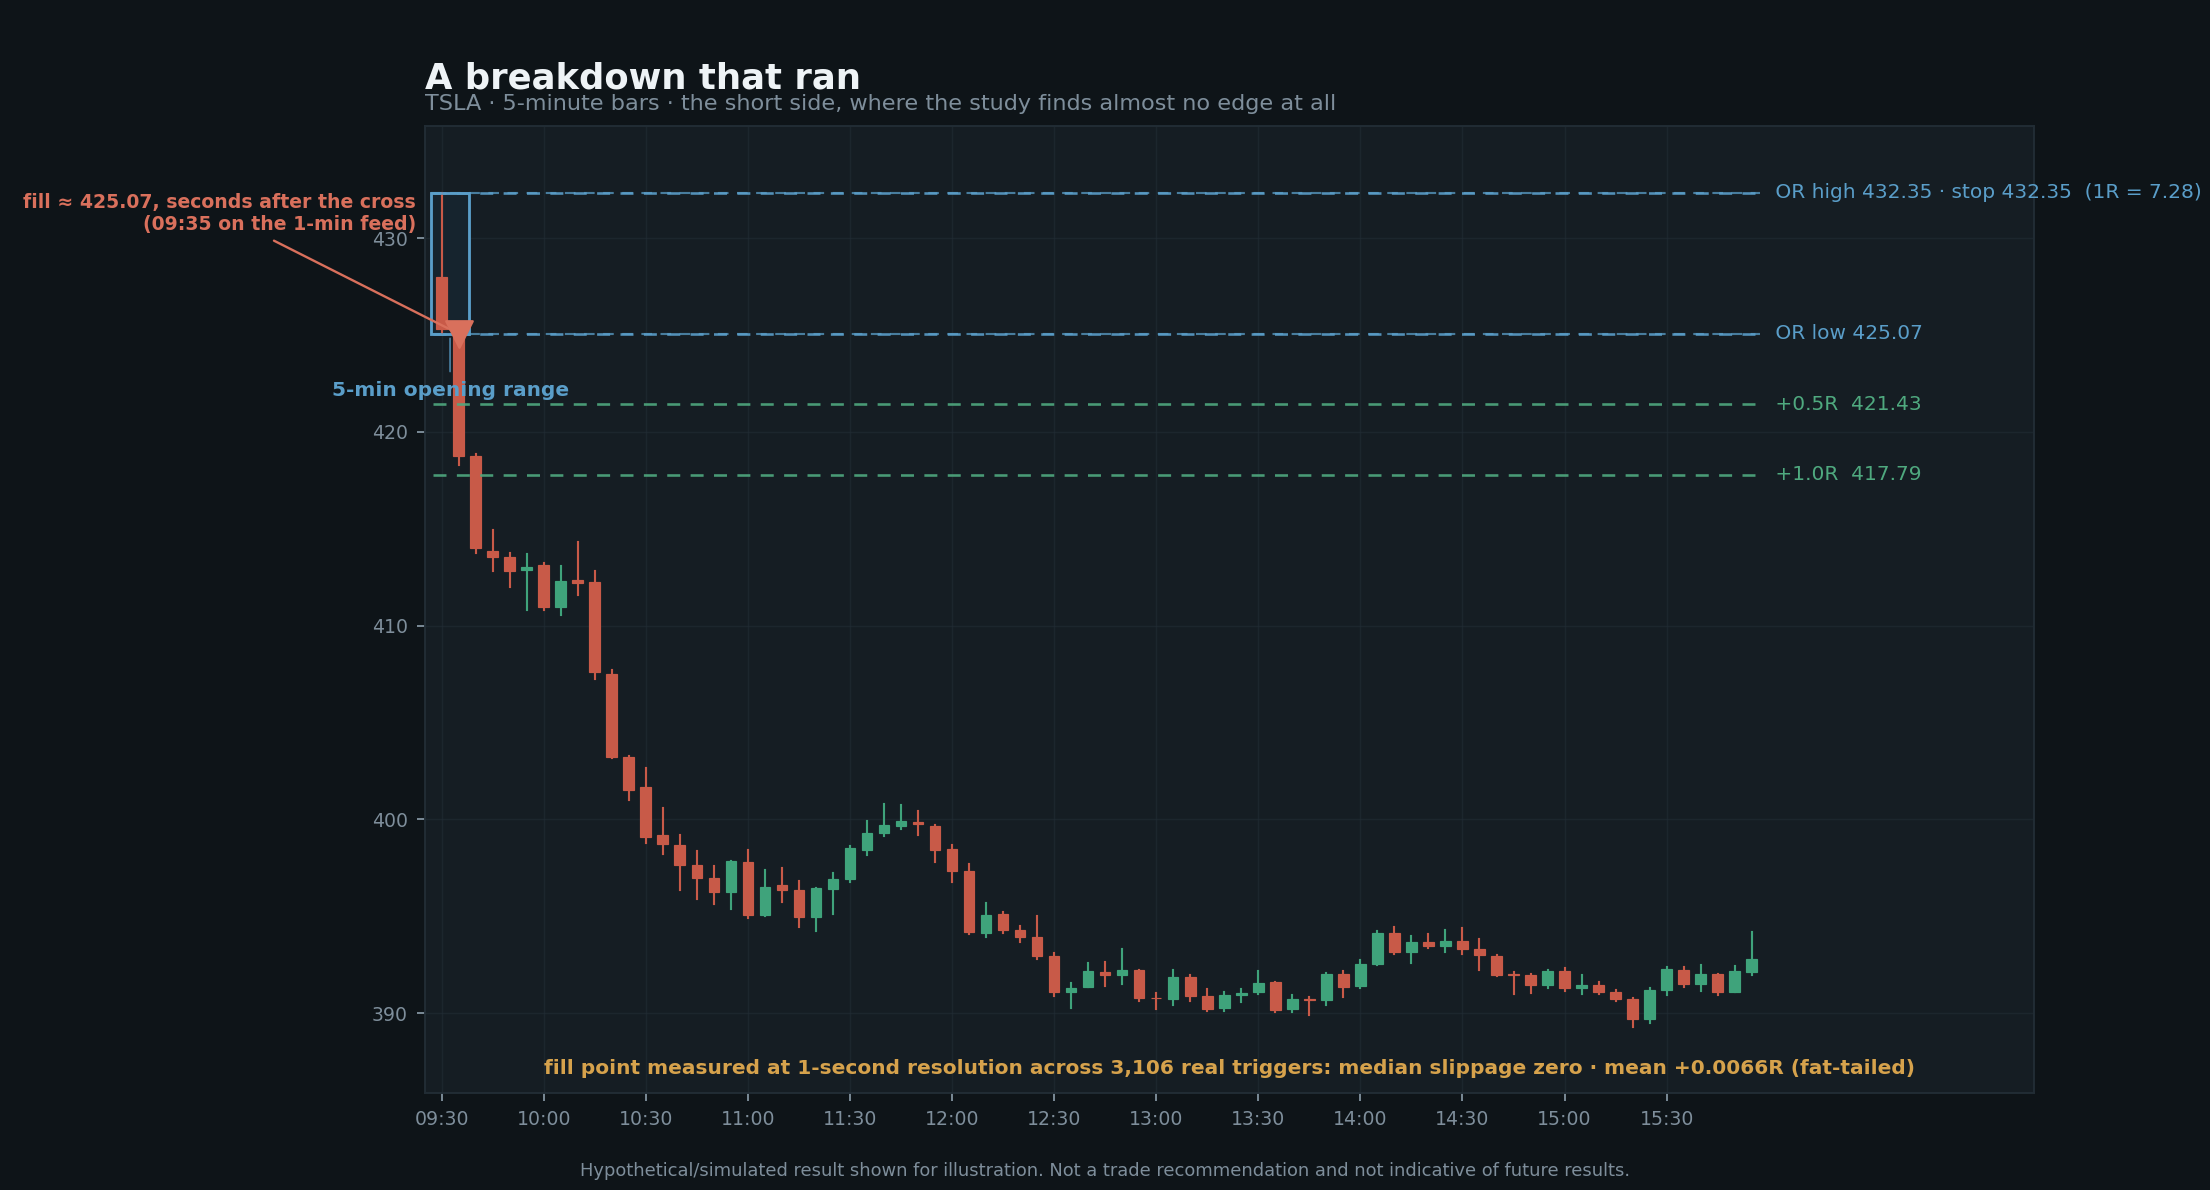
| Long breakouts | 71,240 | 54.3% | 1.054 | +0.019 |
| Short breakdowns | 71,108 | 53.6% | 1.009 | +0.003 |
Essentially all of the edge is long. Short breakdowns at a profit factor of 1.009 are indistinguishable from nothing — and this simulation does not even charge borrow costs, which would push them below water. That result is consistent with the market's structural upward drift, and it should temper any article that presents ORB as a symmetric, direction-agnostic system.
The second concentration is the overnight gap.
| Overnight gap versus breakout direction | Trades | Profit factor | Avg R |
|---|---|---|---|
| Breakout with the gap (gap > 0.2%) | 56,444 | 1.058 | +0.020 |
| Breakout against the gap | 59,557 | 1.017 | +0.006 |
| No meaningful gap (±0.2%) | 26,256 | 1.008 | +0.003 |
A breakout that continues the overnight gap carries roughly three times the expectancy of one fighting it. Put the two findings together and the conclusion is narrow and specific: a gap up followed by an upside break of the opening range is the only cell of classic ORB with a real pulse. Everything else in the matrix is noise around zero.
Filters move the win rate, not the edge
This is where most "improved ORB" content goes wrong, and the mechanism is worth naming because you will see it everywhere once you know what it looks like.
Add a 5% penetration buffer — requiring price to push 5% of the range width past the edge before you enter, to filter out marginal pokes. The win rate climbs from 53.9% to 56.0%. That is a real, measurable, two-point improvement, and it is exactly the kind of number that gets bolded in a blog post.
Expectancy goes from +0.011R to +0.011R.
The same thing happens with longer ranges. A 15-minute opening range wins 55.3% of the time and a 30-minute range 55.1%, at roughly +0.010R and +0.009R. You have bought a higher win rate and paid for it in average win size, which is what filtering out marginal entries does: you skip some losers, but the entries you do take are further from the level, so risk unit and reward both re-scale. The scoreboard does not move.
Win rate is a comfort metric. It tells you how often you are right, not how much being right is worth. Any ORB variant sold on a win-rate improvement alone is selling cosmetics until someone shows you the expectancy alongside it.
It works on stocks, not on the index
Of the 95 symbols with at least 500 trades in the sample, 65 — 68% — were net positive. SPY was not one of them. The S&P 500 ETF itself came in at a profit factor of 0.94 and an average of −0.023R per trade, placing it among the ten worst names in the universe.
SPY is the default instrument in most ORB tutorials, which makes that worth knowing. The dispersion across single names is wide: the best names cleared profit factors in the 1.1 to 1.3 range, the worst sat between 0.84 and 0.95, and the distribution is continuous between them. One name, CMG, printed 1.68 — an outlier we do not trust as a forward-looking claim, and which we mention only so the shape of the distribution is honestly represented rather than quietly trimmed.
We are deliberately not publishing a "trade these ten tickers" list. A ranked table of historical winners from a 104-name universe is a description of the past with a recommendation's grammar, and the gap between those two things is where retail traders lose money. The generalisable finding is structural, not a list: the breakout edge lives in single-name momentum, and the index dilutes it away. An index is a basket of names breaking out in different directions at the same moment; averaging them is precisely how you destroy the dispersion you were trying to trade.
One caveat we will state rather than bury: the universe is today's list of 104 liquid names, which flatters the early years of the sample. That is why the conclusions we draw are relative comparisons — fill model against fill model, long against short, with-gap against against-gap — rather than absolute performance claims. Relative comparisons survive universe bias; absolute ones do not.
Regime beats parameters, and it isn't close
Profit factor by calendar year: 2020, 1.05. 2021, 1.10. 2022, 0.97. 2023, 1.00. 2024, 1.05. 2025, 1.05. 2026 through August, 0.99.
The best year and the worst year are separated by roughly 13 points of profit factor. Every parameter choice we tested — 5 versus 15 versus 30-minute ranges, buffer versus no buffer, minimum-range filter versus none — is separated by about three. The gap between market regimes is four times the gap between any two configurations of the strategy.
2021, a low-volatility trending melt-up, was the strategy's best year; 2022, the bear market, took it negative. Arguing about five minutes versus fifteen optimises a variable that contributes a fraction of what the environment contributes — a variable you can control instead of one you can't, which is a very human choice and not a profitable one.
A null result worth publishing: the day of the week
Search for the best day of the week to trade ORB and you will find confident answers. Here is ours, across 142,348 trades.
- Monday: +0.015R
- Tuesday: +0.023R
- Wednesday: +0.004R
- Thursday: +0.007R
- Friday: +0.005R
The entire spread is within noise for an effect of this size. Tuesday looks like the winner and Wednesday the loser, and if we published that as a finding you could trade it for a year and learn only that we were pattern-matching on sampling error. There is no best day. Articles that name one are curve-fitting a dataset and reporting the fit as a discovery.
When the range actually breaks
A five-minute range on a liquid stock does not survive long. 95.2% of first triggers land between 09:35 and 10:00, at a profit factor of 1.032. The 10:00–11:00 window catches another 3.8% at 1.020, and 11:00–13:00 catches 0.8% at 0.995.
The afternoon cell — 13:00 to 15:49 — shows a profit factor of 1.170. That is the highest number in the table and we are telling you to ignore it. It rests on 358 trades out of 142,348, three tenths of one percent of the sample. At that count the confidence interval swallows the result whole. If we were selling something, that 1.17 would be a headline. It is noise, and the only responsible thing to do with a number like that is label it.
Why the strategy nets out near zero
The outcome distribution explains the flat result better than any summary statistic:
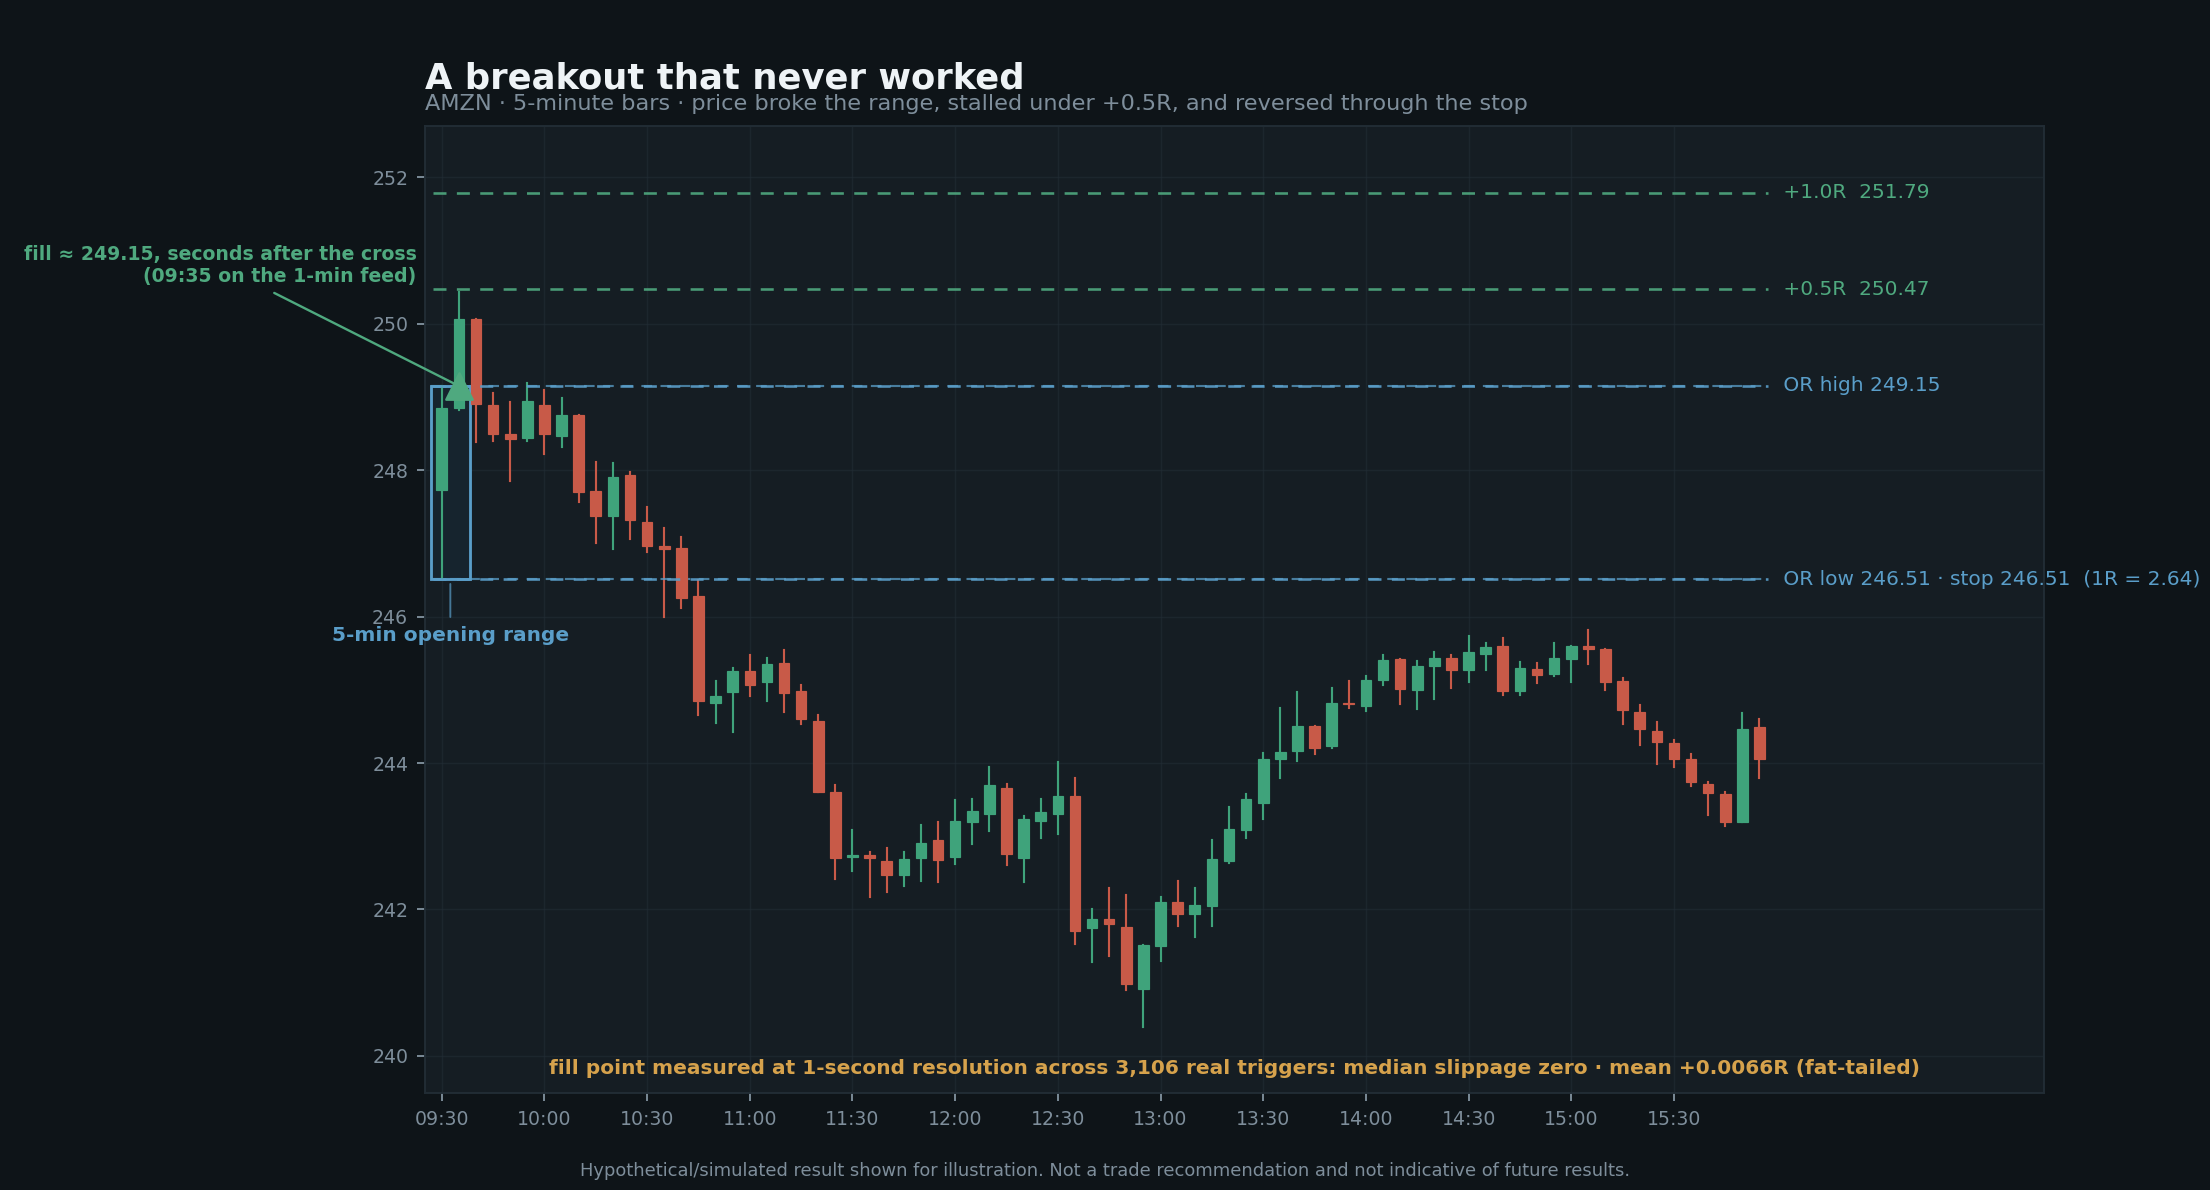
- 44.3% hit both targets, averaging +0.73R.
- 29.8% stopped out straight away, giving back a full −1.00R.
- 11.9% hit the first target and then stopped out, averaging −0.26R.
- 9.0% hit the first target and carried the rest to the close, averaging +0.32R.
- 5.0% reached no target and were flattened at the end of the day, averaging −0.21R.
The winners are capped by the target structure at +0.73R. The losers are not capped — they are the whole risk unit. Forty-four percent of trades earning three quarters of a unit against thirty percent losing a full one is, arithmetically, a near-tie. Every filter, every range length, every entry buffer is a small perturbation of that arithmetic.
Why you can trust these numbers
A backtest is only worth what its implementation is worth, and ORB has enough ambiguity in it — does the trigger require a close beyond the level or just a touch? what happens when a stop and a target sit inside the same bar? — that two honest people can build it and get materially different answers.
So we built it three times.
Three engines were written independently by three people from a single written specification, then reconciled against each other until all three produced byte-identical output on all 344 fixture trades. Seven days disagreed at first pass. Every one of those seven traced to a data gap or a stale file on one engine's side — not one traced to ambiguity in the strategy definition. That reconciliation is what lets us report a difference of a few thousandths of an R between configurations and mean it.
On top of that:
- Every fill is knowability-audited. Three mechanical checks run as scripts, not judgement calls: the price had to be knowable before the fill, the fill has to sit inside the bar's actual traded range, and any close-derived signal has to fill at the close. A backtest that can see the future is the most common way this kind of study goes wrong.
- Every ambiguity resolves against the strategy. Same-bar stop and target conflicts resolve stop-first. Stops fill at stop-or-worse when price gaps through. Targets are resting limit orders, never assumed fills. Where the simulation has a choice, it takes the pessimistic branch.
- The fill measurement is data, not a model. The 3,106 one-second fills are measurements of what happened around real triggers, sampled with a fixed seed so the sample is reproducible, not a parameterised slippage assumption tuned to produce a comfortable number.
What we do and don't do with this
TrueTrader does not trade the opening range breakout as a live strategy. This is research, not a description of what our desk does at 09:35. Publishing a study of a strategy is not the same as running it, and we would rather say so plainly than let a 142,348-trade sample imply a track record that doesn't exist.
What the study is good for is calibration. If you trade ORB now: are you long-biased and gap-aligned, or taking every break in both directions? Single names or the index? And have you checked where your orders actually filled on your best-looking breaks, as opposed to where your journal says you entered?
The broader lesson is the fill one, and it is not specific to opening ranges. Any strategy that enters on a stop order into fast movement pays its largest execution cost on the trades it most wants. Backtest it with level fills and you will not see that cost, because level fills are exactly the assumption that hides it. The strategy will look like it has an edge of +0.023R. It has about +0.016R. And a strategy with +0.016R of edge is a strategy where your broker, your order type, and your commission schedule are not implementation details — they are the whole argument.