ORB Indicator Strategy – A Complete Guide
What is the ORB Strategy?
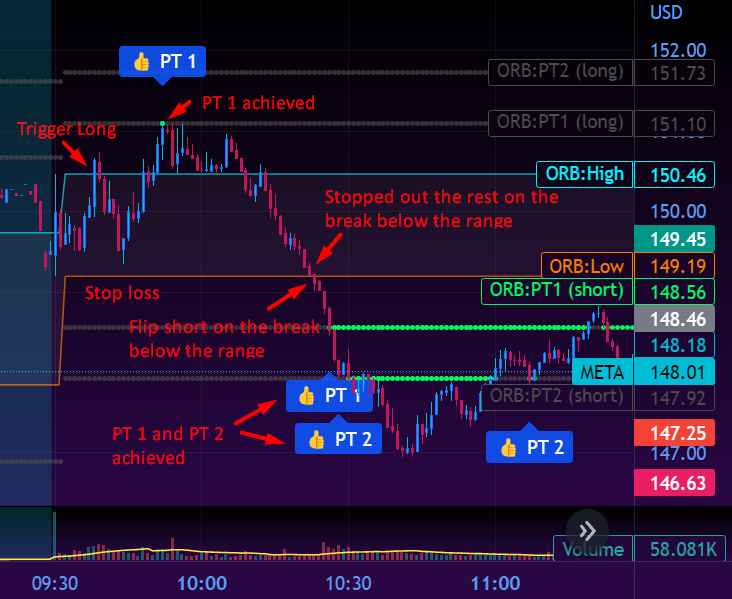
If you’re looking for a successful trading strategy, the opening range break (ORB) can be a great starting point. This is due to the high volume and volatility of the open, which creates plenty of opportunities for profitable trades. The ORB strategy is a trading technique that involves entering a trade when a stock breaks out of its opening range. The opening range is the high and low of a stock during the first few minutes of the trading day. The ORB strategy is used to determine the direction of the market and make trades based on that direction.
In this webinar, we will discuss the TrueTrader ORB indicator setup process, demonstrate how to utilize this indicator and apply the strategy to make profitable trades.
How Does the ORB Strategy Work?
The ORB strategy works by identifying the opening range of a stock and then waiting for a breakout. The opening range can be any time period, but the most common ranges are 3, 5, 15, 30, or 60 minutes. Traders can experiment with different time ranges and adjust them based on changing market volatility.
When the stock breaks out of its opening range, the price action is likely to continue in the same direction. Traders can use the breakout/breakdown as an entry point for their trades. The target for the trade is to stay in it for a minimum price move that is equal to the size of the range risking the whole range.
How to Implement the ORB Strategy?
To implement the ORB strategy, traders need to identify the opening range of a stock and wait for a breakout. When the stock breaks the opening range upwards, it’s likely that the price action will continue in a bullish direction. Conversely, when it breaks the range downwards, it’s likely to continue in a bearish direction. Therefore, the ORB strategy uses the range breakout/breakdown as entry points. This means that you can take a position when the price breaks out of the range in the direction of the breakout.
Setting Your Targets and Stops
When using the ORB strategy, it’s important to set your targets and stops. Stay in the trade for a minimum price move which is equal to the size of the range or to maximize your profit potential, you can trail your stop. To minimize your losses, place a stop loss in the middle of the opening range or you can risk the whole range. You could also use the prior high or low in case of a breakout or breakdown, respectively, if you want a tighter stop.
Setting Up the ORB Indicator
Host: @Options_Mike
To get started, you need to add the ORB indicator to your charts. Here’s how you can set it up on your Tradingview:
- Click on this indicator link – TT ORB indicator for Tradingview.
- Scroll down to the bottom of the page and click on the “Add indicator to favorite” option.
- Open Trading View and click on the “Indicators” tab.
- You can find the indicator under “Favorites” tab.
- Populate the indicator on your chart.
After you’ve added the indicator to your chart, you can adjust the visual settings to your preference. Here are a few things you can do:
-
- Change the color of the high and low lines to make them more visible.
- Turn the lines into dots or any other shape of your choice.
- Choose different colors for the triggered and untriggered lines.
- Turn the background on or off to make it easier to observe and backtest.
Customizing the ORB Range:
You can also adjust the ORB range, which is the time range of the opening range. While three minutes is the most popular time frame, you can experiment with different time frames, such as 5 minutes, 15 minutes, 30 minutes, or 60 minutes. You can turn off the profit targeting flags if you prefer to trade without them. The profit target is calculated by multiplying a numerical value by 0.1. For instance, a value of 5 gives you 50% profit, and 10 gives you 100% profit.
ORB strategy tips and case studies
Host: @Options_Mike

