Broader Market
$ES / $SPY
https://www.tradingview.com/x/2LONWdXt/
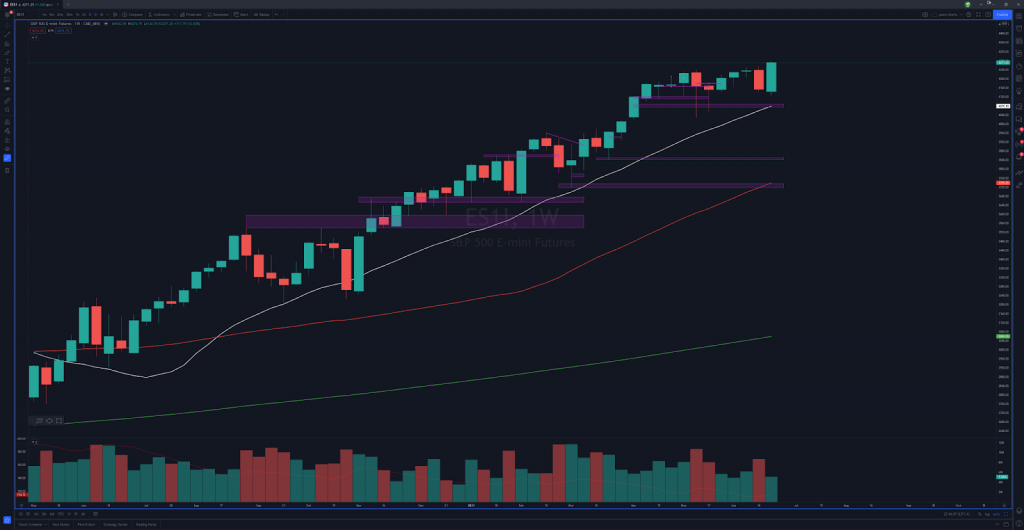
All I can say is “That is one HELLUVA weekly candle” from last week!
Best viewed on Desktop
Daily on the $ES shows we have near-term support at the 20d (4222), the quarterly pivot (4199.25), and the 50d (4186.75). Above, only resistance within sight is the monthly pivot up around 4366. Market looks good and I am willing to put capital into long ideas on stocks that are behaving well with this market.
$NQ / $QQQ
(Best on Desktop)
Nasdaq looks good as ever and we’ve been seeing some tech stocks really start to behave well. I do think we’re a bit extended from the 20d, so the best case scenario for people that are on the sidelines and looking to get long is to wait for a retrace to some support. You might be tempted to chase things long if the market pushes higher, but remaining disciplined for good, high-quality entries should trump everything else. Remember, some people want to make a career out of this. In order to have longevity, you must focus on the bigger picture and ALWAYS be disciplined. If you’re just here to gamble, well then I guess….
…YOLO?
Near-term support is the monthly pivot at 14117.75, the 20d at 13966.5, and the 50d at 13758.25. First area of interest to see if we get resistance is the monthly pivot at 14548.75.
$BTC
(Best viewed on Desktop)
Copy/Paste thoughts from last week:
“The sideways chop continues. Thoughts from last week are the exact same way I feel this week. The best/healthiest look for this thing is for it to base here for a few more weeks AT LEAST, if not for a few months. Will that happen? Who knows? Not my job. All I do is prepare myself for the different scenarios. Again, I don’t trade cryptos, but I still use this to know how I may trade any crypto-related equities. “
Notice, as we continue to go sideways, the things I’ve been constantly repeating week after week start to look more and more like they are actually happening, which is GOOD for crypto. The longer we base, the healthier this becomes, PERIOD.
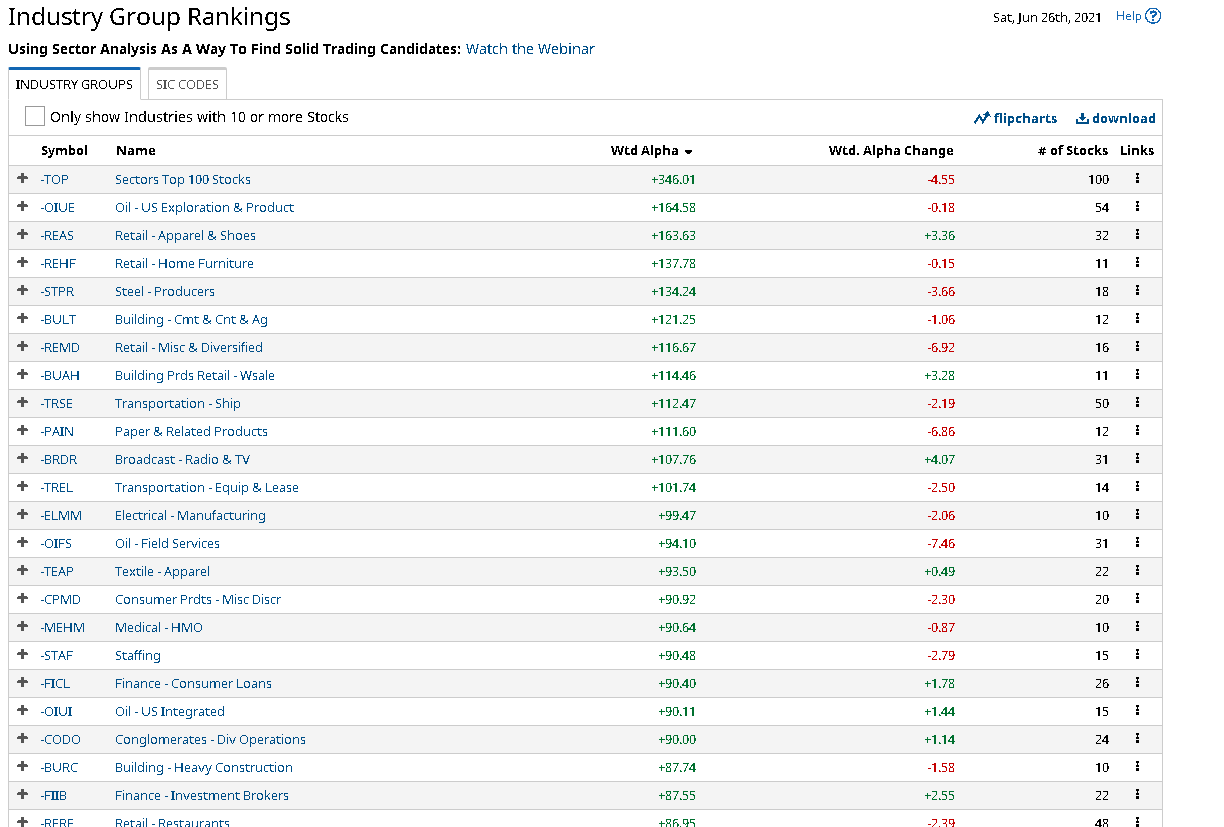
Sector Rankings
Gonna do something a lil bit different this week. Decided that I think it’s useful to teach the readers about some of the FREE tools out there instead of only sharing insights from paid subscription stuff. So instead of using MarketSmith, we’ll now be using www.barchart.com. This site offers MANY of the same insights from the MarketSmith software, minus the monthly fee. Remember, if you’re a member of www.TrueTrader.net, you’ll still always have access to the top 30 and bottom 30 list from MarketSmith, so no need to sweat it.
https://www.barchart.com/stocks/sectors/industry-rankings
^^^This is the link I used to find these rankings.
TOP INDUSTRY GROUPS
BOTTOM INDUSTRY GROUPS

Long Setups
STRONG STOCKS LOOKING FOR CONTINUATION
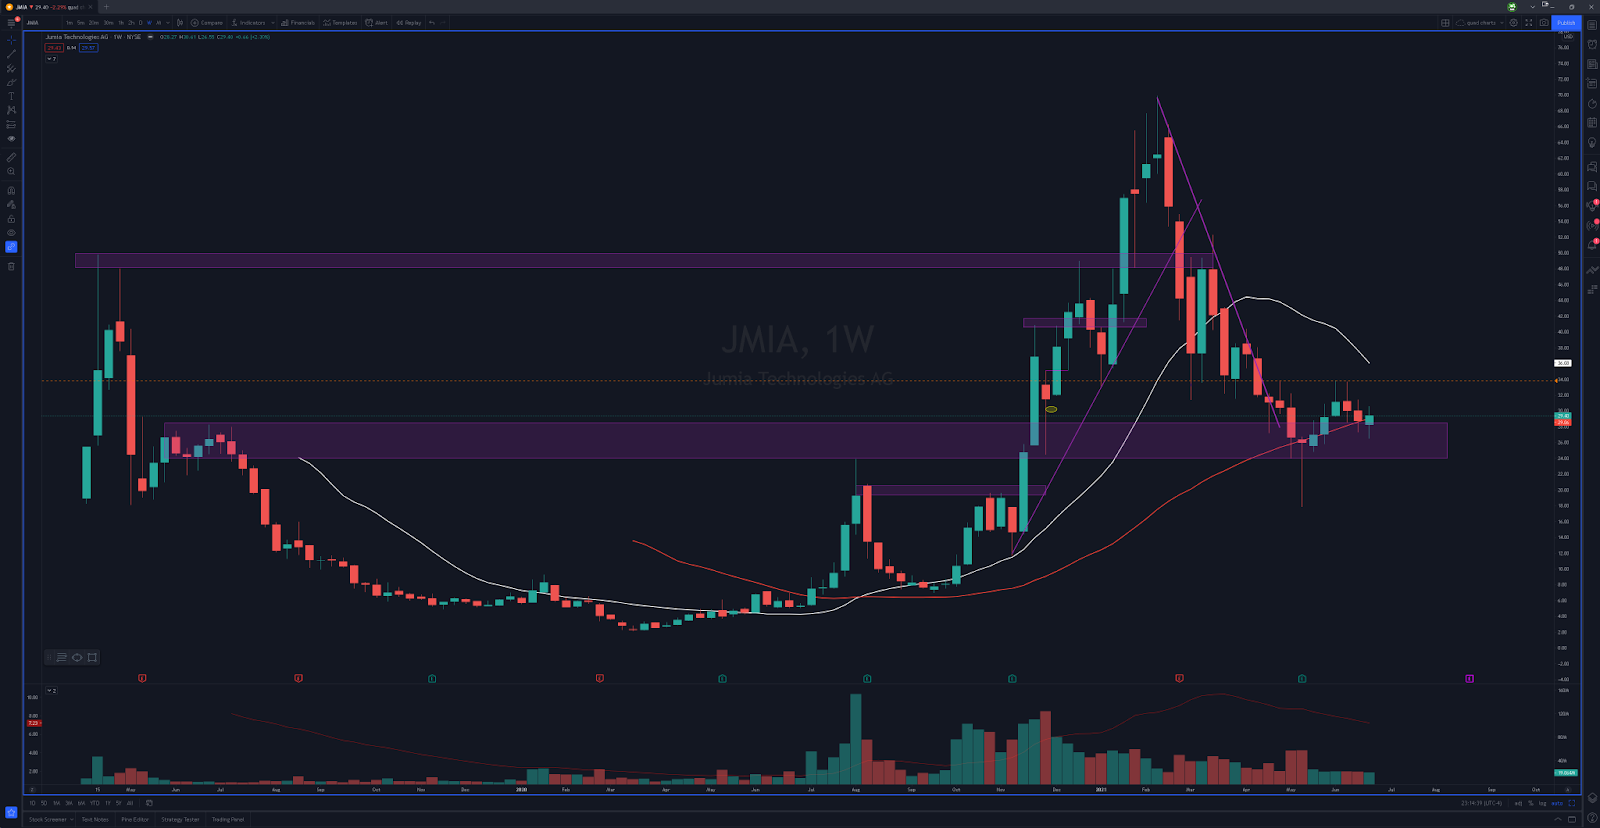
$JMIA
(Best viewed on Desktop)
There is a very strategic reason for having this name on here. If you look at the $TIGR chart (especially the weekly), you’ll see that it has already made the long setup that I anticipated $TIGR could do. We need to break over 34 to really trigger the setup, and at that point I would still want to see pullbacks to support to get long. But I like this chart for an overall swing long.
https://www.tradingview.com/x/2SrjY5WL/
The weekly chart shows the only thing I DON’T like about this setup, and that is the weekly 20sma looming just overhead. But, like I said; I would want this to trigger and then offer better prices later. So that really takes that worry out of the equation. Also, the weekly ALSO shows something that I REALLY love about this chart: Where this pullback came back to. You can clearly see how important this level has been.
$BABA
(Best viewed on Desktop)
After looking at $JMIA, $BABA should actually look a bit similar. Really just retesting a MAJOR area. Only difference is that this name has made the push higher, breaking out of this really long downtrend. Will it hold? We’ll see. But I think you have to treat the situation as though any retest of 215-220 may be a gift and start to look for long entries.
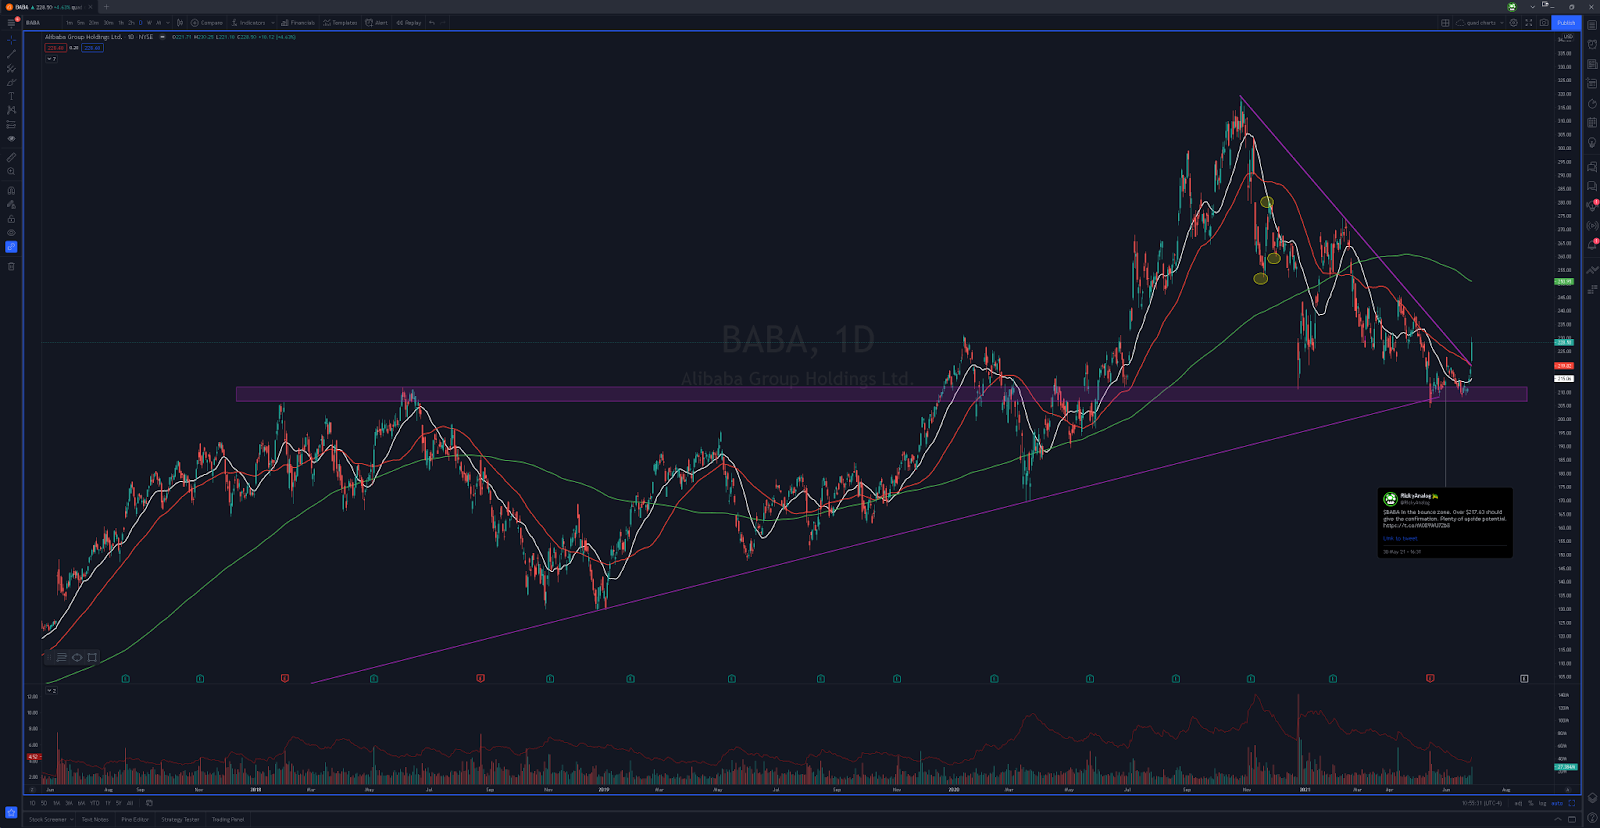
https://www.tradingview.com/x/3QjhoQDx/
Since we’ve already pushed into the weekly 20sma, the next logical level of resistance becomes the daily 200sma. Really excited to see how this one unfolds.
Short Setups
WEAK STOCKS LOOKING FOR CONTINUATION
$KC
(Best on Desktop)
Very defined downtrend here and I still think any pop back into the 20d is a nice spot to look for weakness. If that level doesn’t hold, the same idea can be revisited at the 50d. Both moving averages also have pivots in the same area for added confluence.
OVERBOUGHT REVERSION SETUPS
$ASAN

(Best viewed on Desktop)
I know this idea has been in the Prep for 3 weeks in a row now, but all 3 weeks it worked out EXACTLY like we wanted. And once again, it’s the same setup. Let it extend to points of extremity first, and then look for weakness or for parabolic extension. First level of interest is that quarterly pivot up there at 65.20. After that I think we’re looking for 70.
$SPCE
Best viewed on Desktop
From almost 52w lows to almost 52w highs in the matter of a few weeks. Pretty extreme if you ask me. But anything is possible in the day and age of the reddit boards and highly shorted names. Was really surprised to see on Friday that the highest the strike prices went out on the options was $60. That means that earlier in the week, you may very well have had a lot of dealers selling premium on 45s, 50s, and 55s thinking “there’s no way they run the price way up here.” Well a lot of them probably were walking around funny this weekend as the stock gapped up Friday on news and the volume was the highest volume day the stock has ever had. Will be looking for this to test ATHs and possibly start to show weakness. But if this is going to be a gamma squeeze play, the best short may end up being later in the week. We will have to see how they play this out. Still may offer a nice short on Monday, and then they find support, only to head higher midweek.
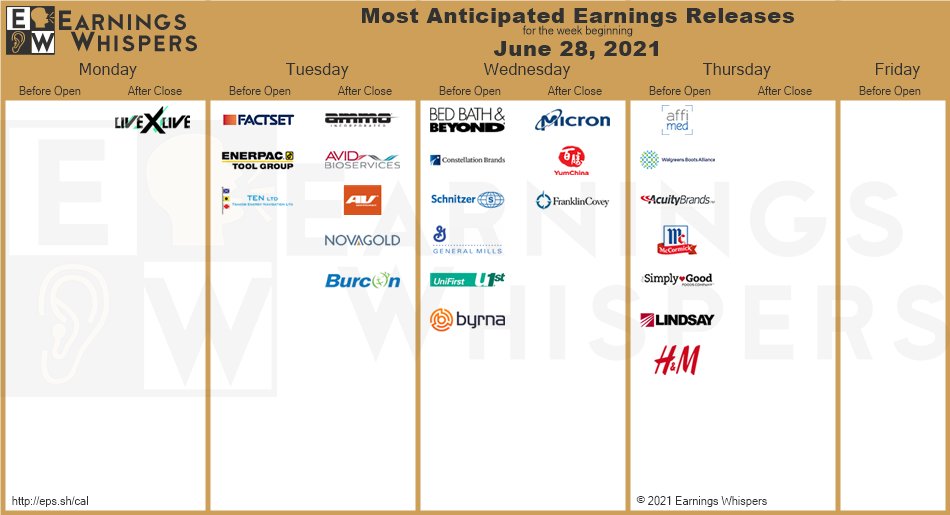
Earnings
Here is this week’s lineup
$MU
(Best viewed on Desktop)
As always, when there is a lot of week ahead of us before the numbers come out, will depend on where we’re trading heading on into the numbers. But you can see my areas of interest. Areas above price represent levels where I may look to fade, and levels below price represent areas where I think we may be offered nice scoops. These ideas are only for quick daytrades, not swings.
$MU Weekly Chart

(Best viewed on Desktop)
Weekly chart shows just 1 more real area of interest, and that is the weekly 20sma currently at 86.44. So if we’re trading 3-5% below that level when the numbers come out, then that area may be a spot I would look to fade.
That’s it from me for this weekend. Hope you all enjoyed time away from the screens and made some memories with the people that matter the most in your life. If you didn’t, then why TF not?!?!?! One of my favorite quotes is from Gary Vaynerchuk.

Ultimate Motivation in 3 Words: “You’re Gonna Die!” (Now do something about it)
— Gary Vaynerchuk