Trading Terminology
In the preparation of this guide you’ll see a few industry terms common to trading. We’re adding this key to help you understand this analysis better in case you’re not familiar with them.
| Term | Description |
|---|---|
| “20d” | Daily Simple Moving Average with length set to 20 |
| “50d” | Daily Simple Moving Average with length set to 50 |
| “200d” | Daily Simple Moving Average with length set to 200 |
| “ATHs” | All time highs |
| “stuff” “price stuffs” | When a price that is surging higher abruptly stops and reverses |
| “fades” | When price drops (suddenly or gradually) |
| “roll over” | When price reverses an upward trend and begins a downward trend |
| “get long” “scoop” | Buying low expecting upward price |
| “break” | When a stock’s price crosses a specified level. (e.g. If the stock moves up from $49 to $51 it can be said to “break” the $50 level |
| “spike” | When price rises suddenly |
| “gap up” “gap down” | When the stock price opened higher (or lower) than it closed the day before, thereby leaving a gap |
Broader Market
$ES / $SPY

https://www.tradingview.com/x/1QFYyR5Z/
Last week we saw a very orderly pullback to the 20d and an immediate bounce with some beautiful strength. This is very constructive price action and ATHs lay just ahead of us. $4,275-$4,285 looks to be the first area I’d expect to see some resistance if we are to get our next leg up. If we stuff the highs and roll over, there are a lot of levels of support below that would make great areas for us to look for buyers to show up. The first obvious spot is the 20d where buyers showed up last week. If that doesn’t hold, we have the monthly pivot right below there at $4,156 and then below that is the 50d at $4,132.
I personally don’t trade the futures or indices, but merely use them as a way to gauge how to trade the big names that move with the market. If we get extended into the 4270s then I would be looking for other extended names that are pushing into resistance for possible fades. If we pull back to support and buyers show up, I would be looking to get long strong names that are holding key support levels. Just figured this was worth pointing out.
$NQ / $QQQ
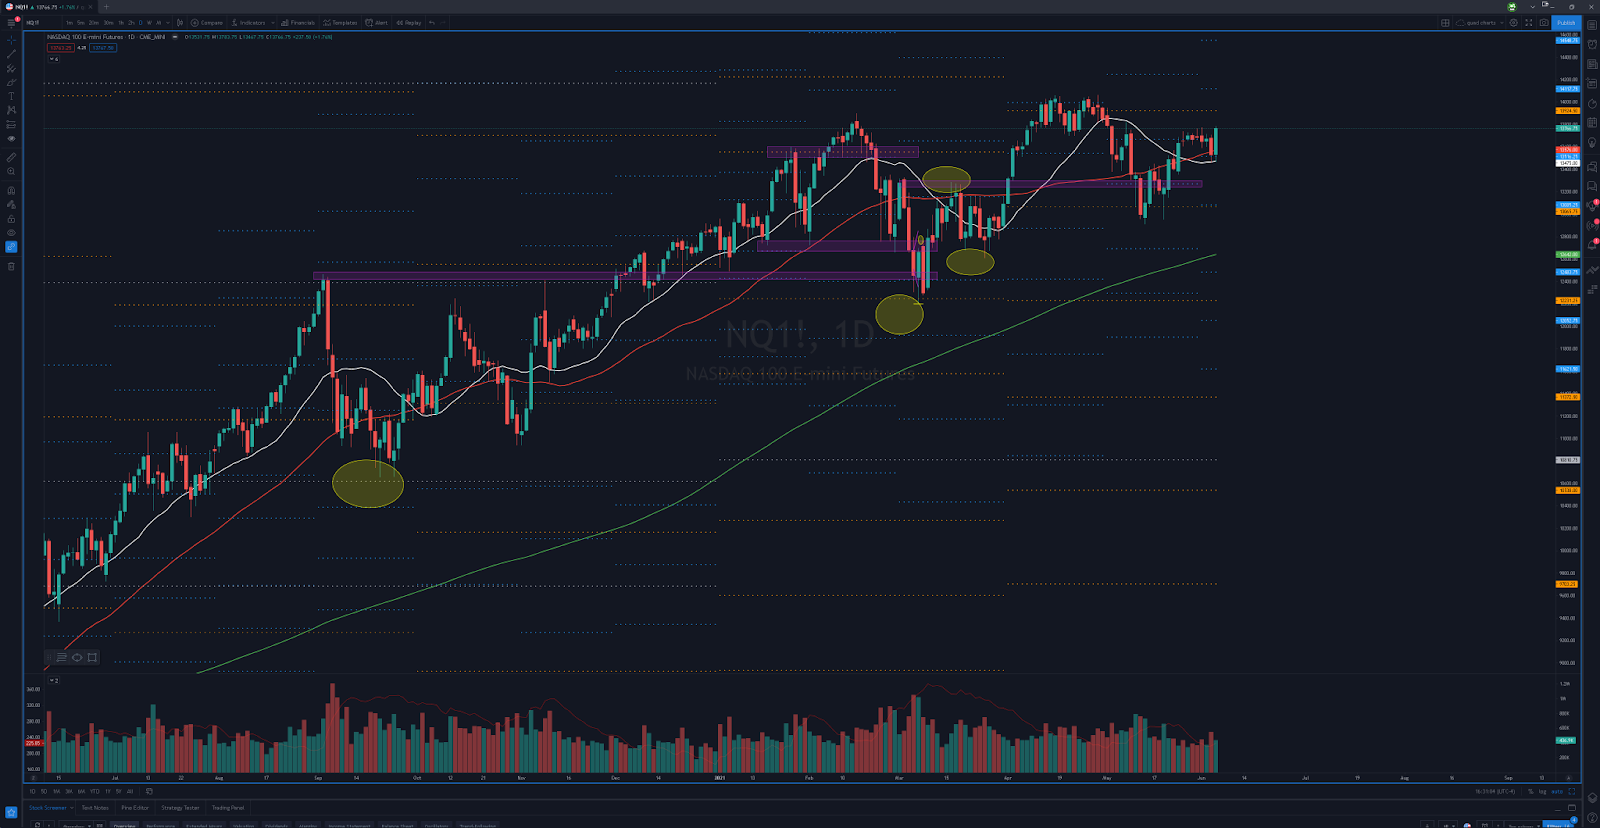
https://www.tradingview.com/x/YH9iqcDn/
Again, a beautiful pullback to the 20d followed by a strong bounce. ATHs within reach and everything looking healthy. Same way I use the $ES / $SPY to gauge how I will trade other names, I use the Nasdaq to gauge how I would be trading tech stocks. It also helps to highlight if there is relative strength/weakness in the tech sector vs the S&P 500. Resistance levels would be the quarterly pivot at $13,924 followed by ATHs. Over ATHs and I would look for sellers to show up around $14,117 at the monthly pivot. For support I would be looking at the 50d, the 20d, and then below that would be $13,065-$13,085.
$BTC

https://www.tradingview.com/x/S1pt7Vv2/
BTC is still struggling, no matter what anyone promoting this vehicle claims. Read the chart and stay objective. It’s the only way to keep your emotions and opinions out of the equation. Will we break below $33,333 again? If so, we very well may be in for a test of that ever-important $20k level. Please review notes on the name from last week’s report since much of it still holds true to this. If it can push back over $40,900 without first heading lower, then just maybe it can steady the ship and try to head back higher. But that’s a tall order for the time being. Remember, they just had their Bitcoin Conference this weekend down in Miami and from what I’ve seen, it was a total clown show.
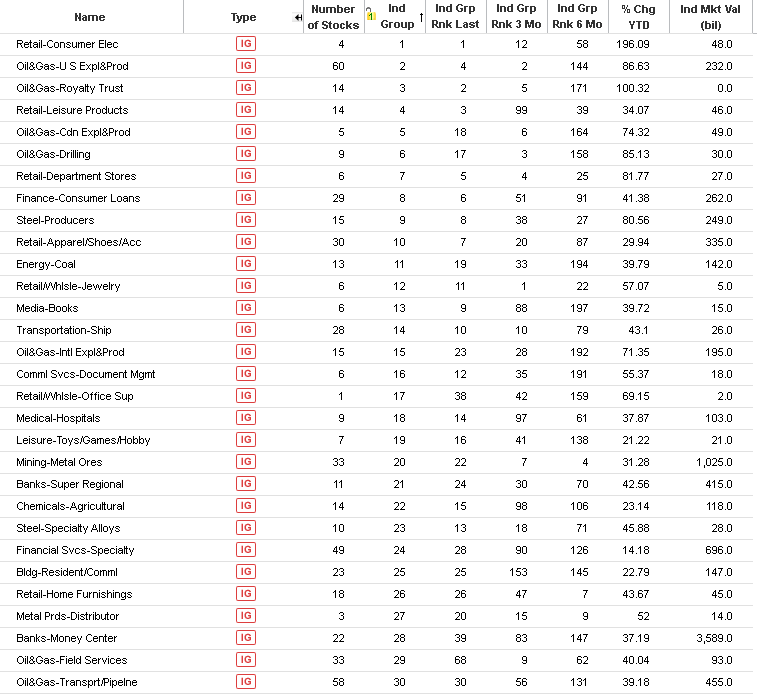
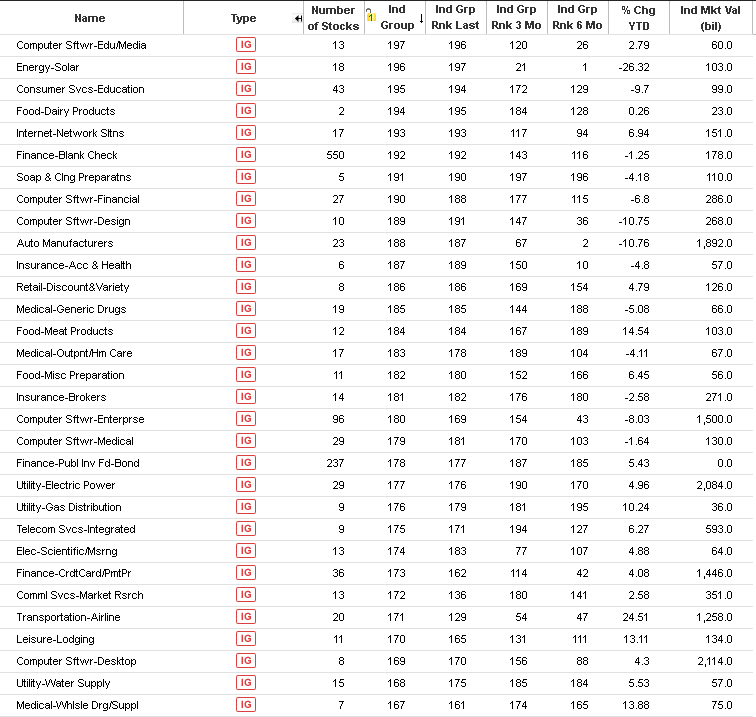
Downloadable MarketSmith Industries Ranking List
Here is the link to the Full List of Industry Groups and their ranks compiled by Market Smith:
https://docs.google.com/spreadsheets/d/1hjNbm84vy3D9uPVKmstuSmeQUDS9T4c4pnQ95zsj8Ks/edit?usp=sharing
Long Setups
STRONG STOCKS LOOKING FOR CONTINUATION
Here’s the top 30 groups ranked by MarketSmith. Notice it’s still a lot of retail and oil groups. Keep in mind, it doesn’t mean that these groups are the most likely to go higher. It just means that this is where the money flows point. For example, retail was in the top groups last week as well. But retail was also a bit extended in many names and needed a pullback. Many of those names got those pullbacks last week and look much better this week.
$X
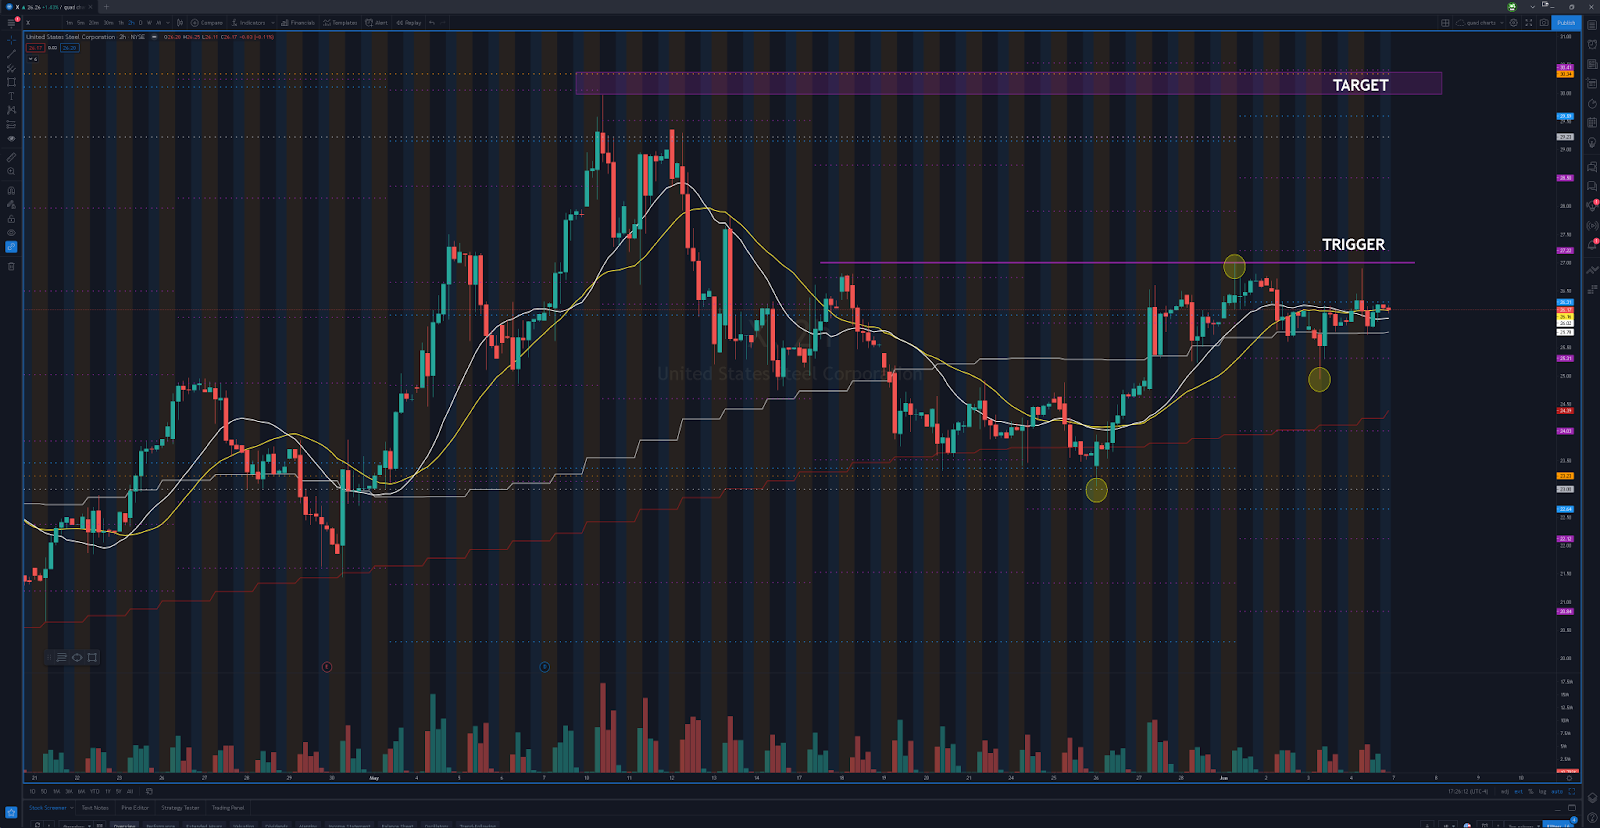
https://www.tradingview.com/x/sBdyZKWD/
Think over $27 and this can see $30. Doesn’t mean you have to buy it the second it breaks over $27 though. I would prefer to see if break, then watch for dips to hold and then join trend with defined risk.
PROTIP: you can see the EXACT same setup on $CLF. So keep both on watch. Maybe one goes and the other doesn’t.
$DOCU
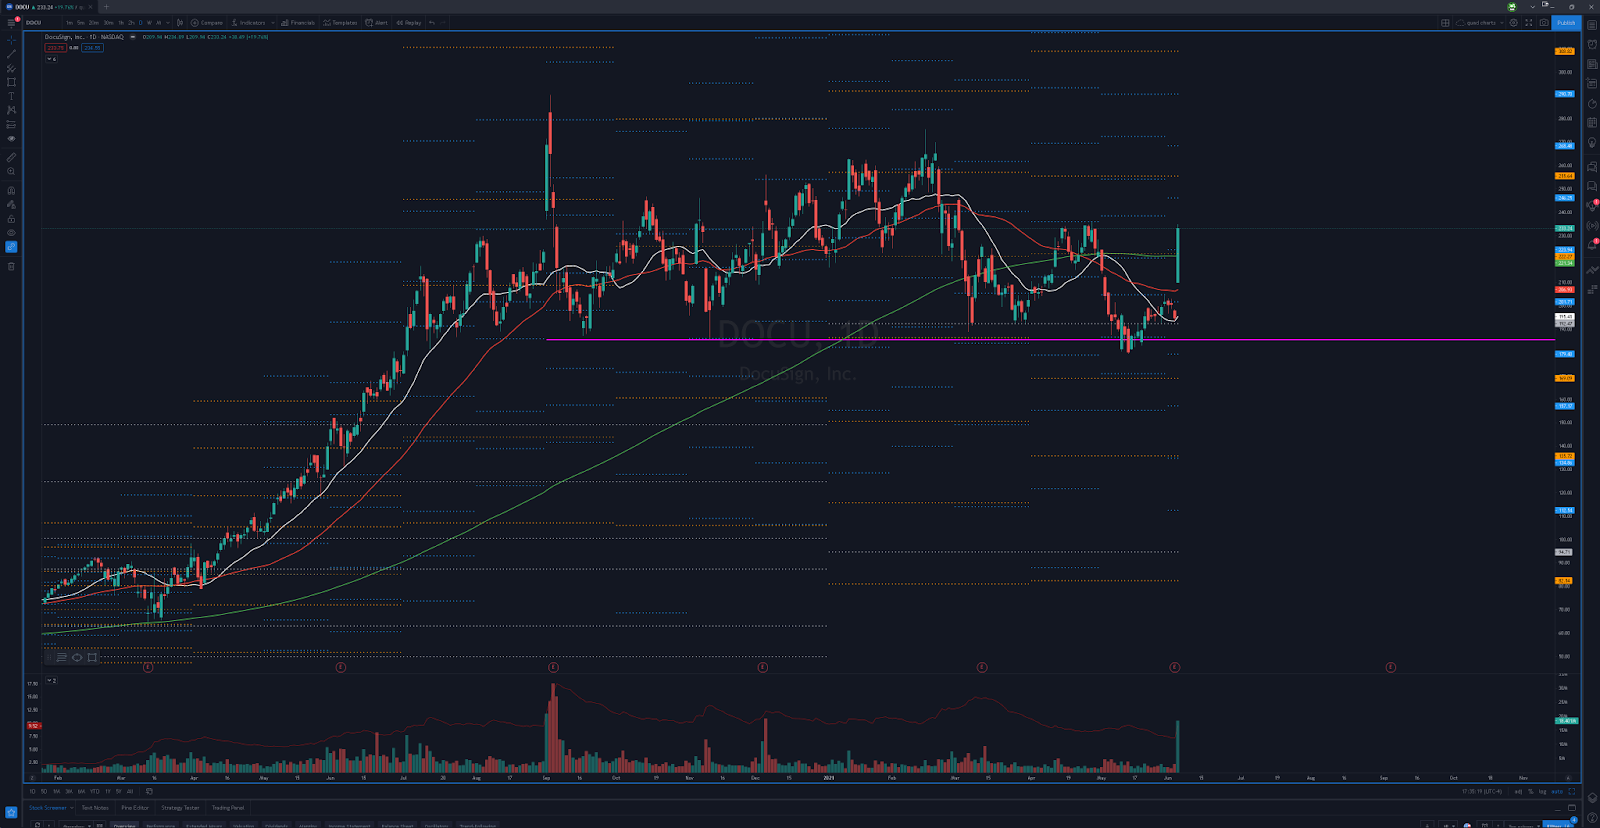
https://www.tradingview.com/x/O23DLv7y/
At risk of sounding like a fool, I’m putting this on here. Why would I sound like a fool? Well, for starters it was in last week’s report in the earnings section where I thought the 200d would be a good spot to try a fade (in fact I DID try to fade it there last week and made a point on ½ and stopped the 2nd ½ breakeven). Secondly, it’s in a weak industry group. But here’s the thing, I don’t care about being wrong, and I don’t care about looking like a fool. What I care about is making money. And you would be crazy to not have this on watch when it had such a standout day on Friday with a candle like the one it put in on the kind of volume that it generated. I will 10,000% be watching this for an opening setup on Monday to see if it has more gas in the tank. Could easily see this wanting $250+. Even if it flushes off the open, really think the 200d acts as a good spot to look for a scoop. #LFG
OVERSOLD REVERSION SETUPS
$YY
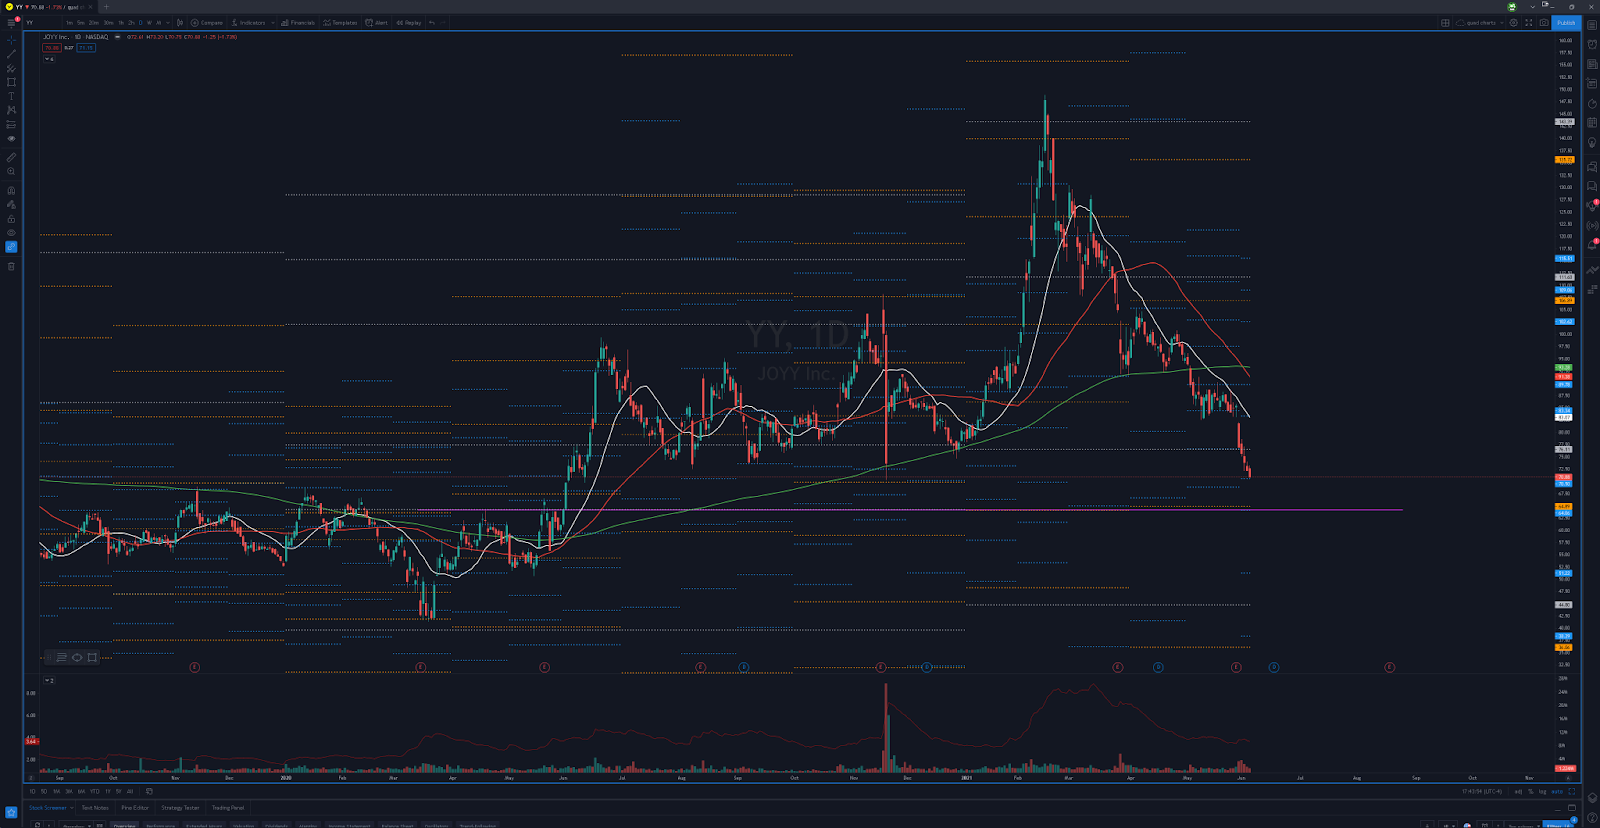
https://www.tradingview.com/x/MI94rCUr/
Think this name can actually come down a bit more, but won’t hesitate to take long setup if it doesn’t. If it does wash more, the spot I’m interested in looking for a scoop would be down around $64-$65.
Short Setups
Here are the bottom 30 groups ranked by Market Smith
WEAK STOCKS LOOKING FOR CONTINUATION
$FSLR
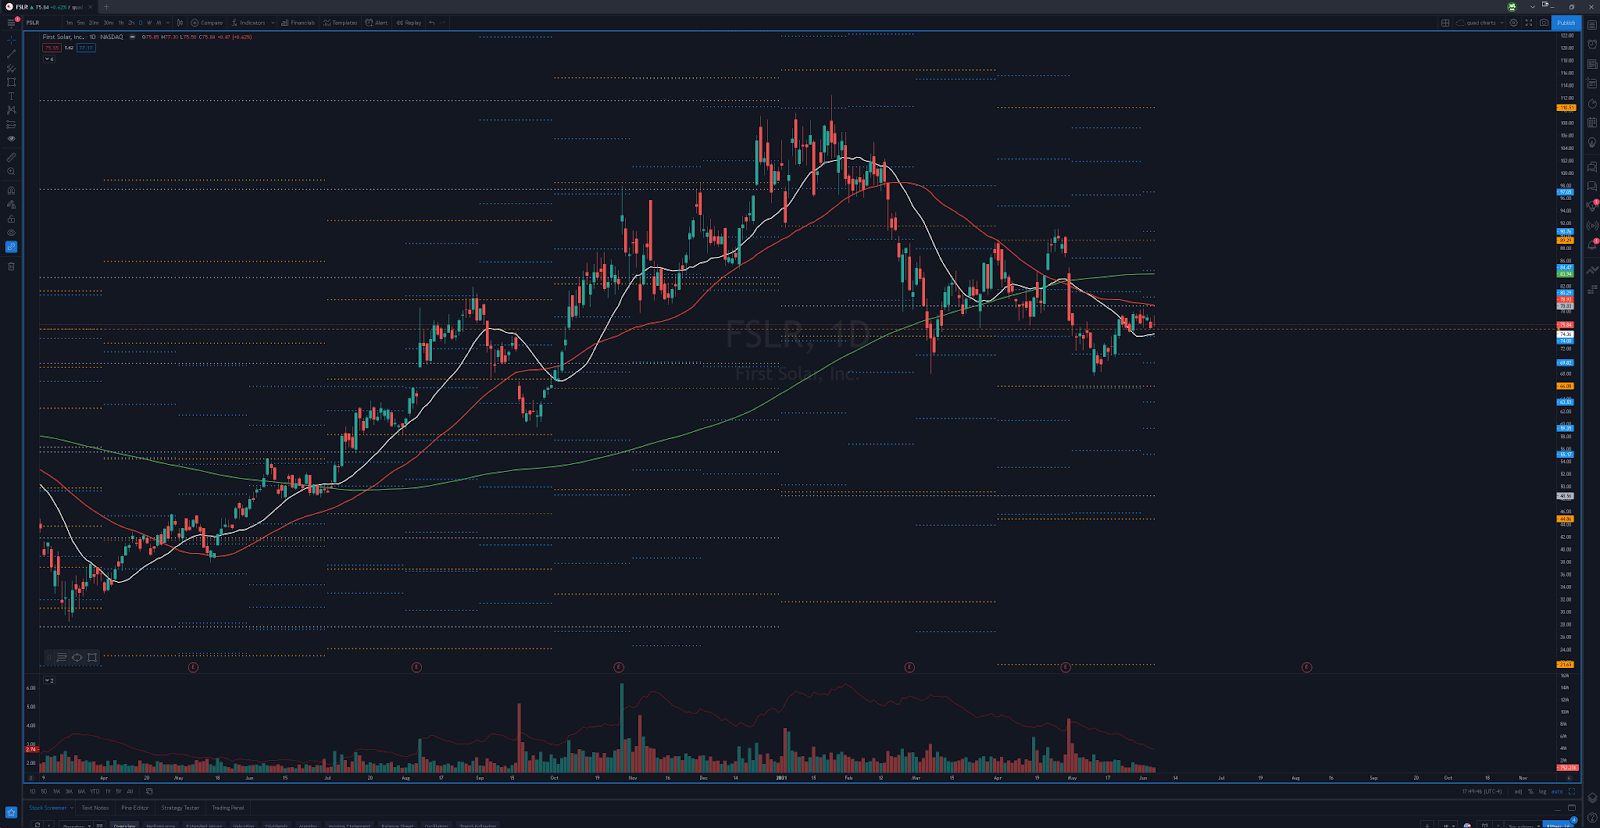
https://www.tradingview.com/x/NF53ibZ1/
Two different ways I may look to play this.
- If we lose last week’s lows I may look to join trend on pops.
- A spike into the 50d/annual pivot point should offer a nice opportunity to fade this.
$CTLT
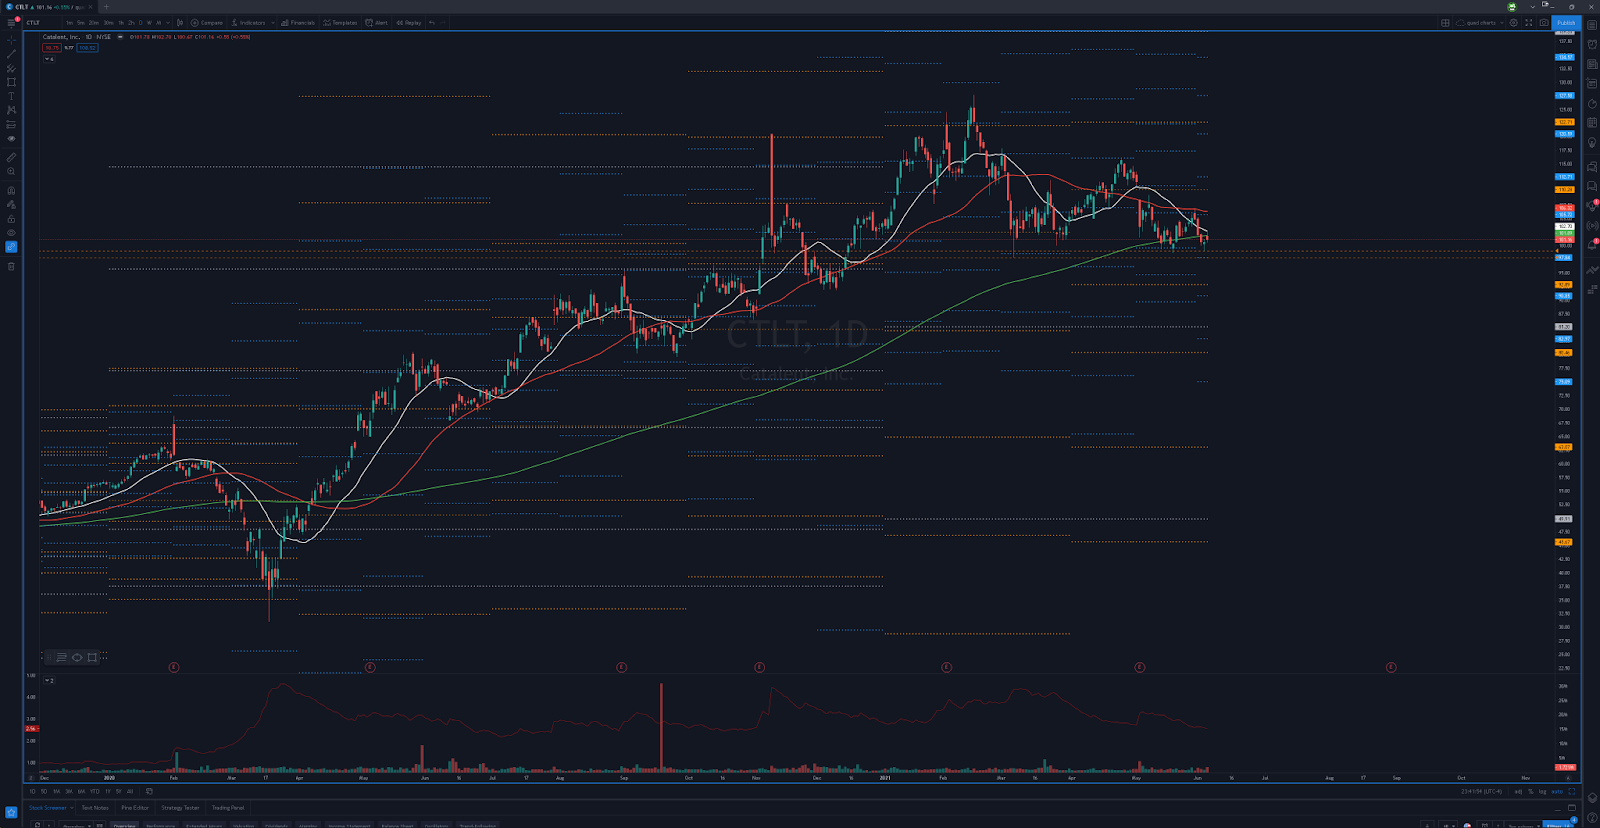
https://www.tradingview.com/x/ezNsiRTH/
This really looks like it’s ready to take a plunge. First level I’m watching is for it to break below Friday’s lows. This doesn’t give me full confirmation that the move is ready, but it’s definitely a start. Full confirmation for me would be if we lose $97.86. Under there and I think she goes tumbling. Will be on watch all week long to see what develops.
OVERBOUGHT REVERSION SETUPS
No setups grabbing my attention this week.
Earnings
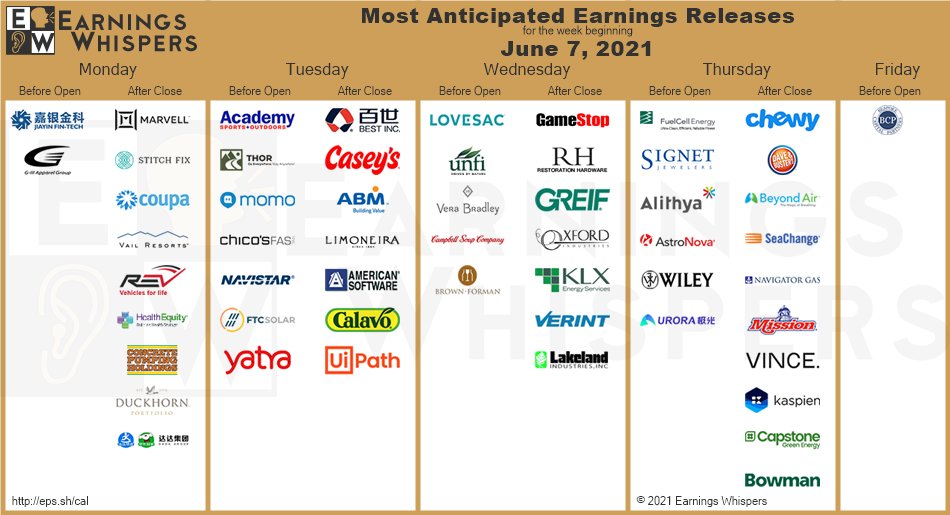
Here is this week’s lineup.
$MRVL
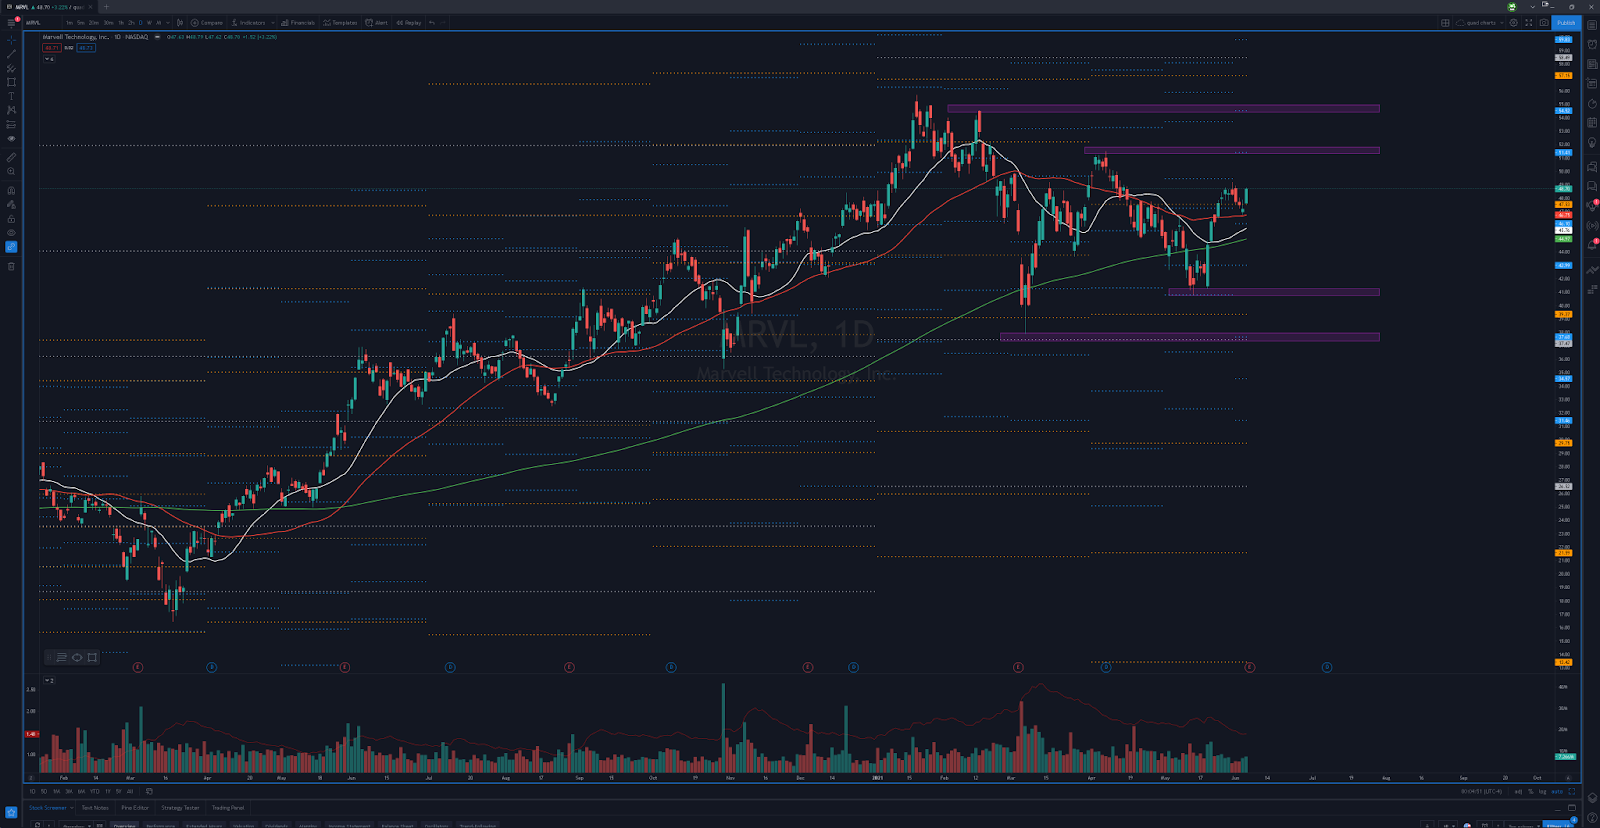
https://www.tradingview.com/x/sGew4y12/
Plain and simple, a gap up and then spike into any of the purple areas above I would look to fade and a gap down and flush to either of the levels below I would be willing to scoop.
$CHWY
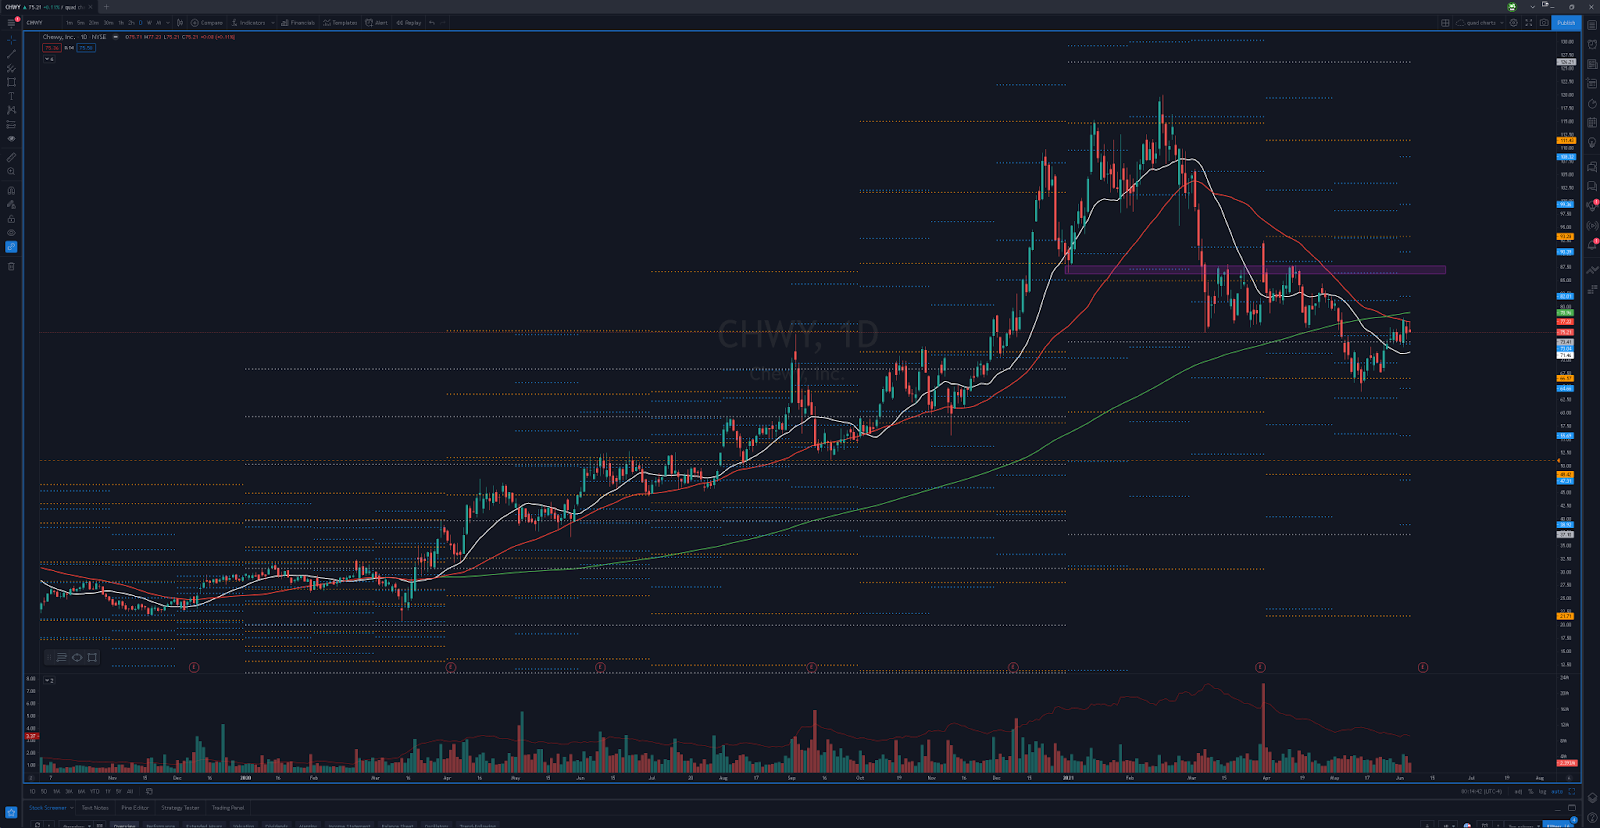
Since this one reports later in the week, will have to see where it’s trading once the numbers come out, but would definitely entertain a fade on any big gap and spike into the $86.30-$87.50 area. If they miss on numbers and gap down, I would still probably be more interested in fade a pop back up than trying to dip buy it since it’s been weak and recently retested the underside of the 200d.
$PLAY
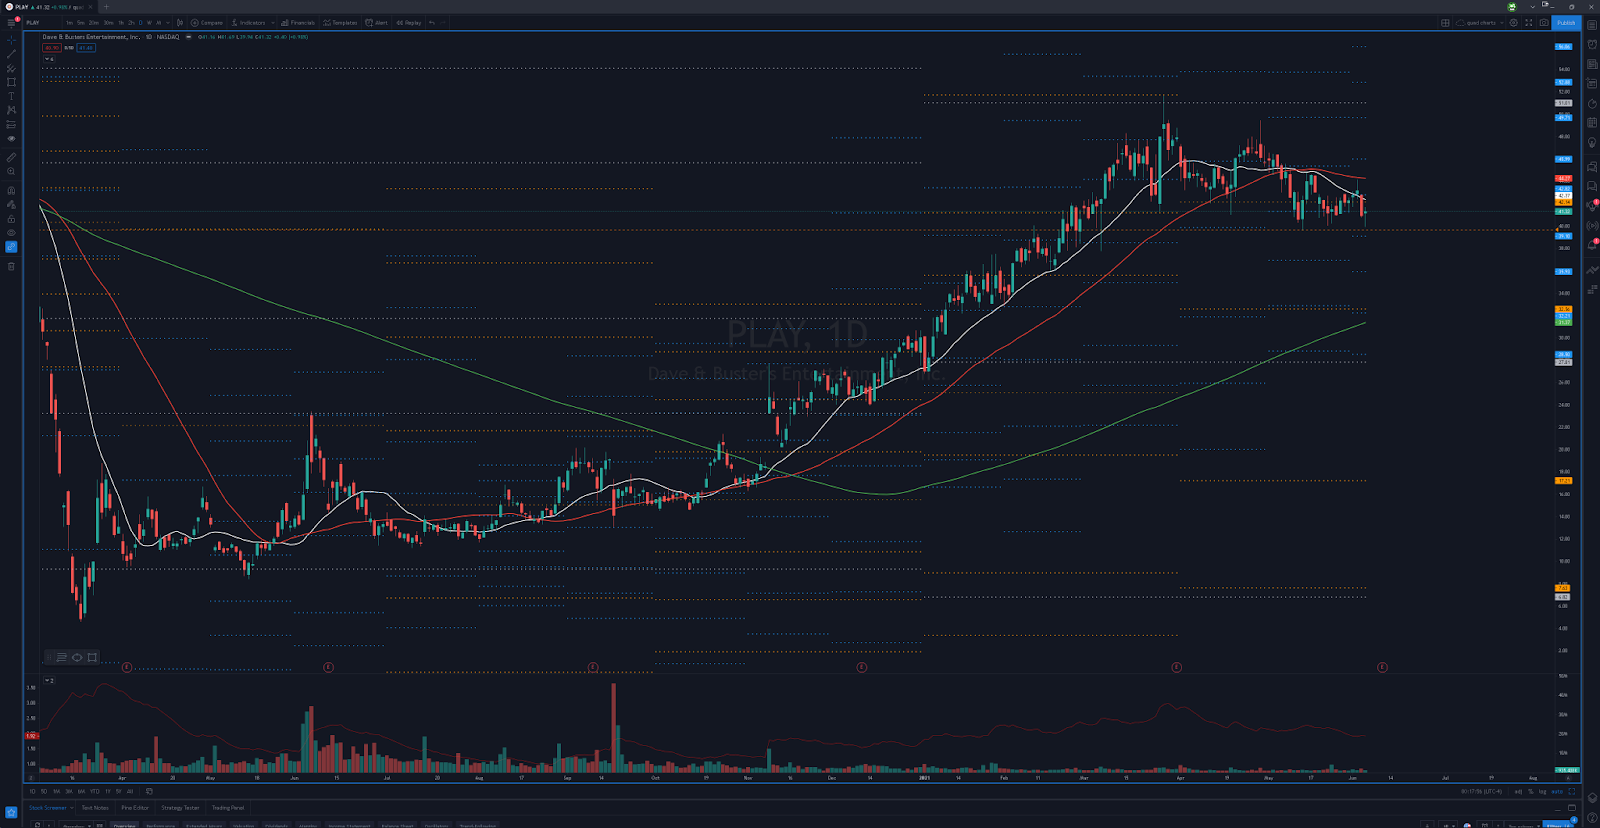
https://www.tradingview.com/x/PYjzzXSg/
This looks dangerously ready to flush from these levels. Not sure it will even hang on to the levels here until earnings on Thursday after the close. I would almost entertain a short on the name if it loses $39.64 PRIOR to earnings. But I wouldn’t be swinging anything into the numbers. If numbers come out and it then breaks that level, then I would be wanting to fade pops back into the breakdown levels. If it gapped WAYYYY down towards the 200d, I might entertain a long for an oversold bounce. Any gap up on the numbers and I would be looking to fade against the recent highs up around $49-$50. Thinner name, but on earnings dates it trades enough volume to not worry about getting stuck in an illiquid name.
Obviously there are a lot more names that are reporting, but these were the only ones with charts I thought were worth mentioning. Hope everyone has a great weekend and look forward to seeing you Monday morning to #FSU!!!