Let’s talk about a concept called “Relative Strength” and Relative Weakness.
When the S&P is going red, pay attention to stocks that are holding strong and refuse to roll over. What do you think will happen when/if the market finds a bid and starts to turn? Those strong names usually do really well.
This holds true for the inverse. If a stock is staying heavy while the markets are pushing, that’s relative weakness and can often have followthru to the downside when/if the markets roll over.
Let’s look at an example with Roblox ($RBLX) from Oct 4, 2021
Notice how the S&P 500 ($SPY) was behaving? A big old fat dump…
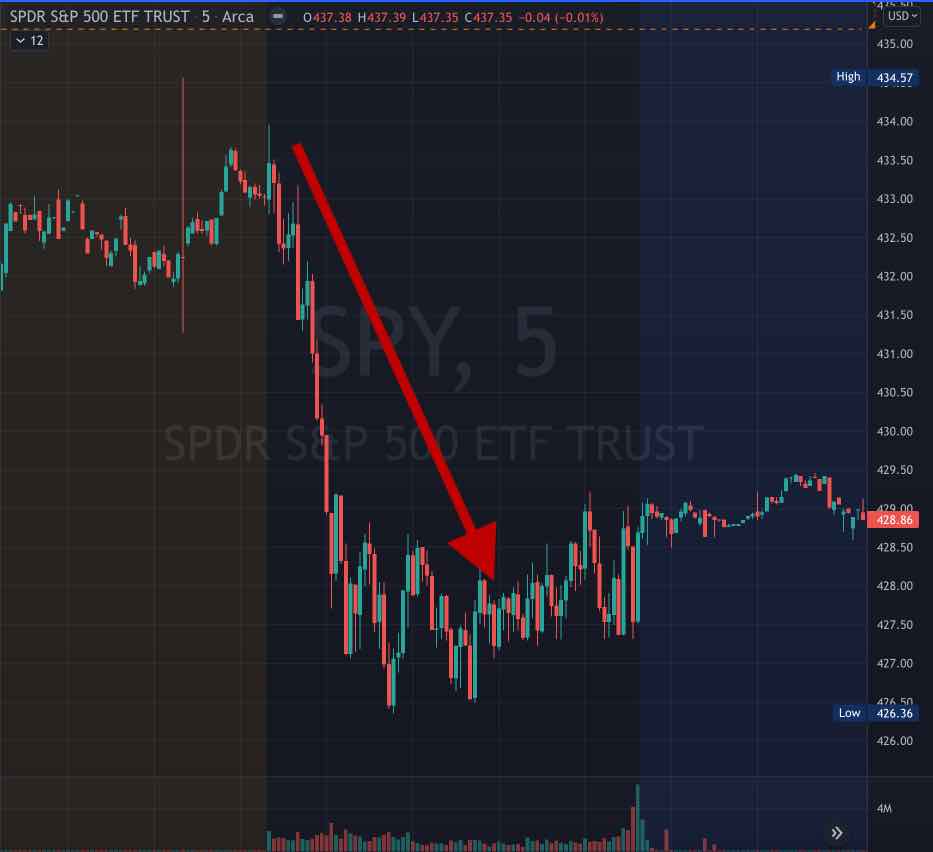
Now let’s look at what Roblox was doing during this same time frame…
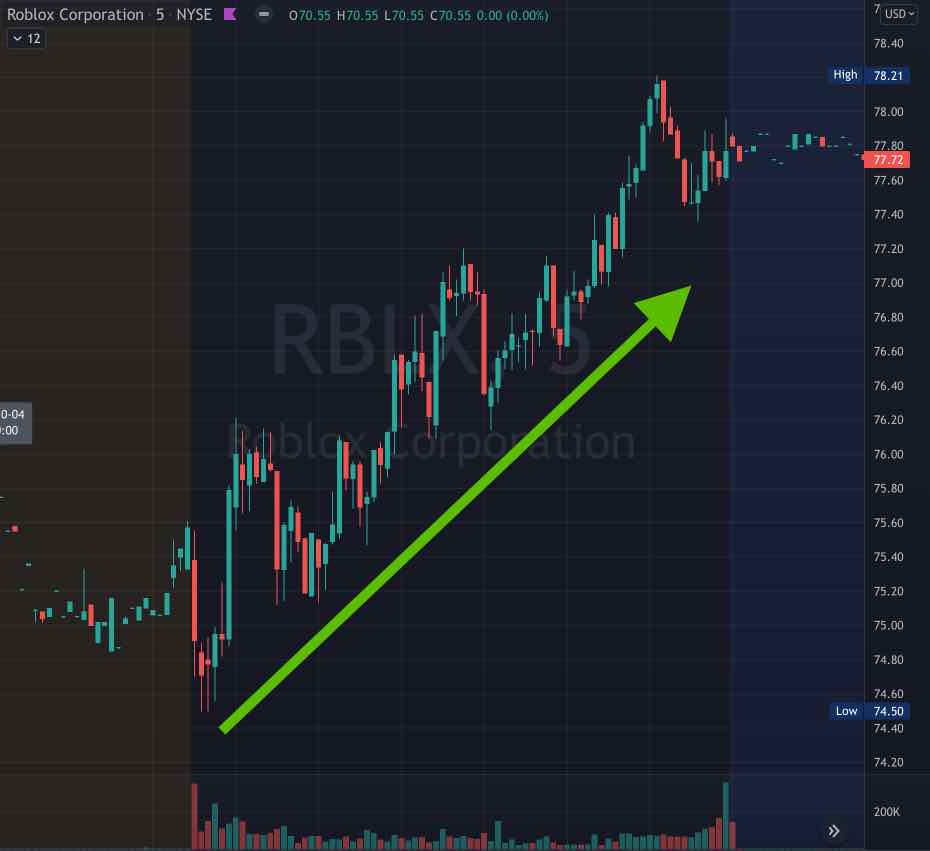
That RELATIVE STRENGTH is exactly what I look for when finding long setups. The inverse is true for shorts.
Here’s a short tutorial on how to set this up in your tradingview charts.
I am CONSTANTLY using this technique to identify stocks for these Sunday Preps, but I also use this in real-time during intraday trading. I really want you guys to keep your eyes open for this kind of setup and watch what these stocks do when the markets make their turn.
BROADER MARKET
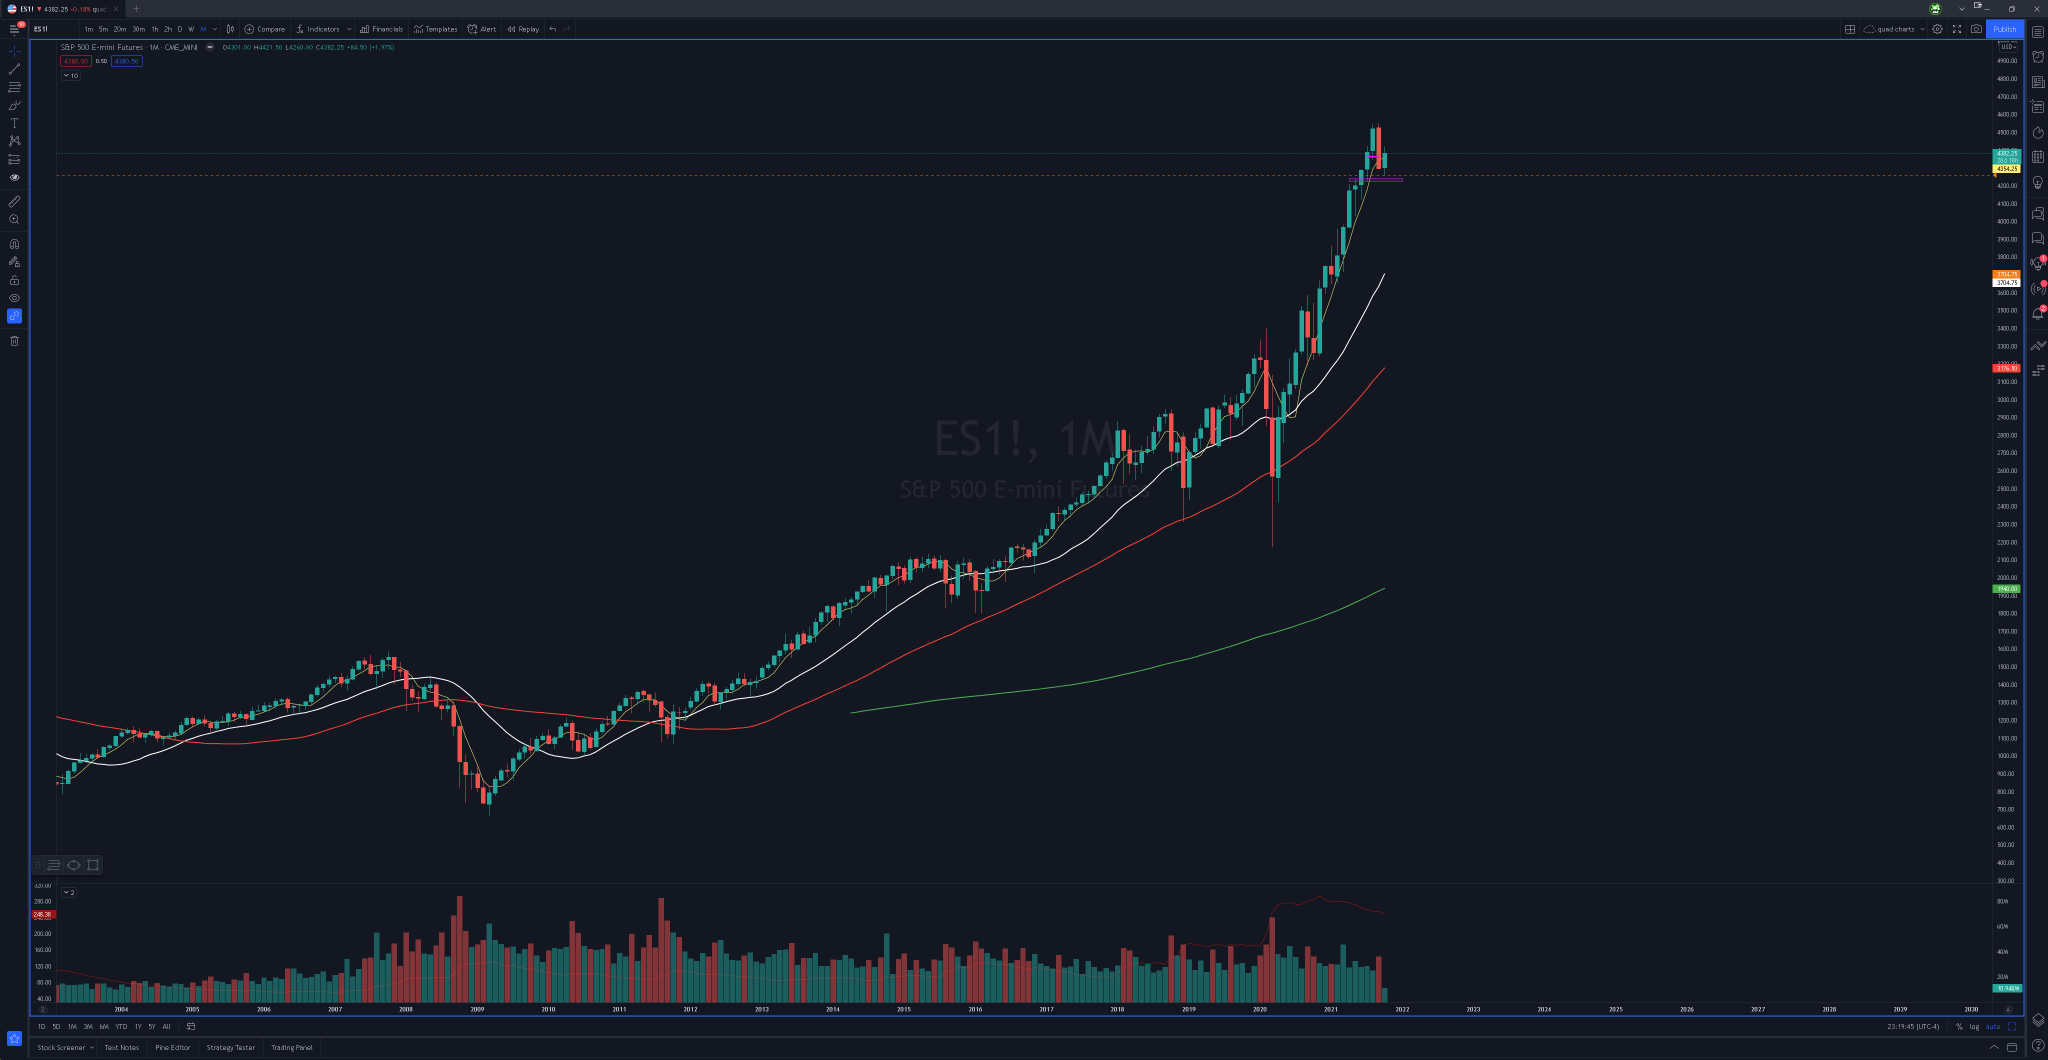
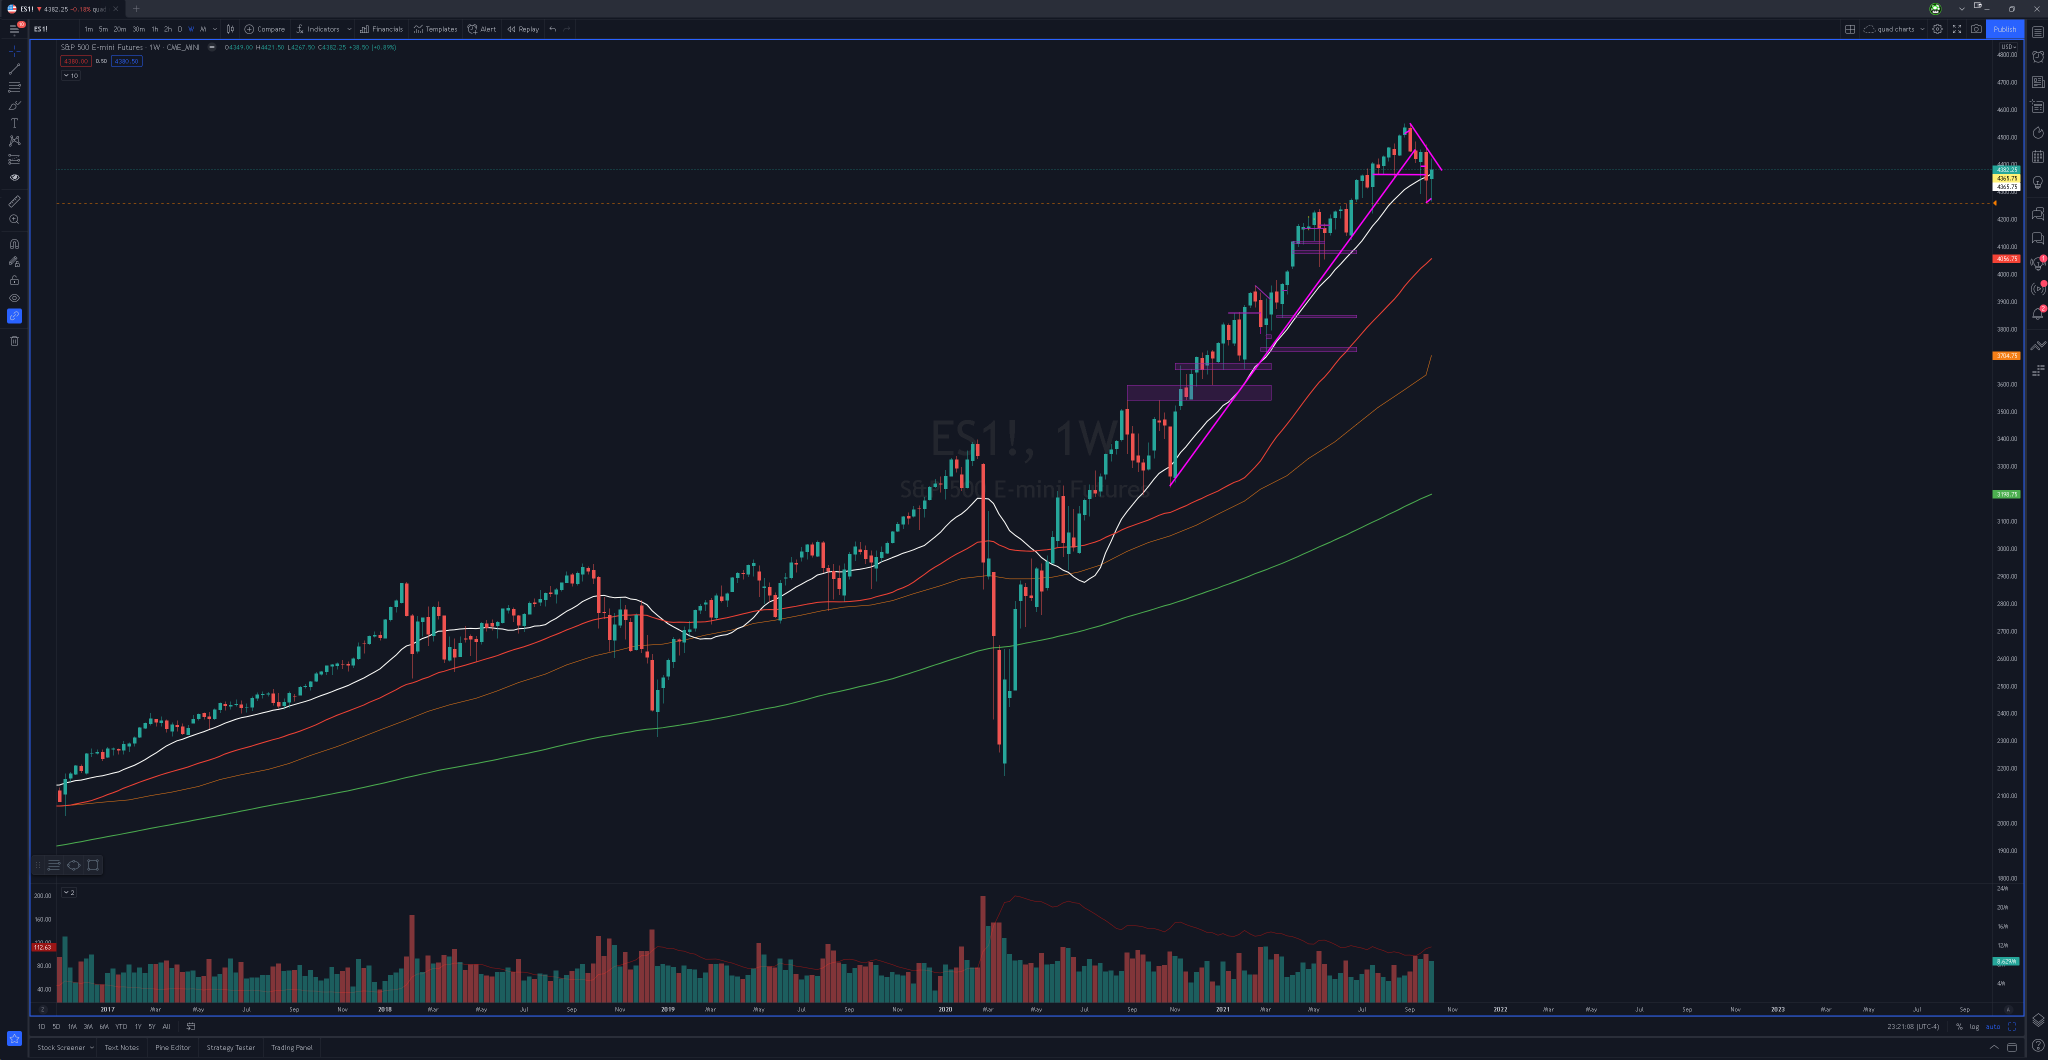
$ES / $SPY
https://www.tradingview.com/x/zC3uyrfL/
It’s very important to always identify which timeframes we are extended on and which ones we are not. I do this by asking if we are extended from the 20sma or are we right on it? If we are far away from the 20sma, to me that signals that we are extended on that timeframe. It’s pretty obvious on the monthly timeframe we are extended. Yes, there is substantial downside if we were to lose the weekly timeframe’s trend.
https://www.tradingview.com/x/OwU5dP6f/
But a quick glance at the weekly chart and it becomes apparent that we are NOT extended on this timeframe. In fact, this pullback we’ve seen over the last few weeks has really just been a pullback INTO the weekly 20sma. So I’m interested if we can start to hold in these areas, start to set a base, and possibly see some narrowing of the range as we get ready to make our next move, either back towards highs or another leg down.
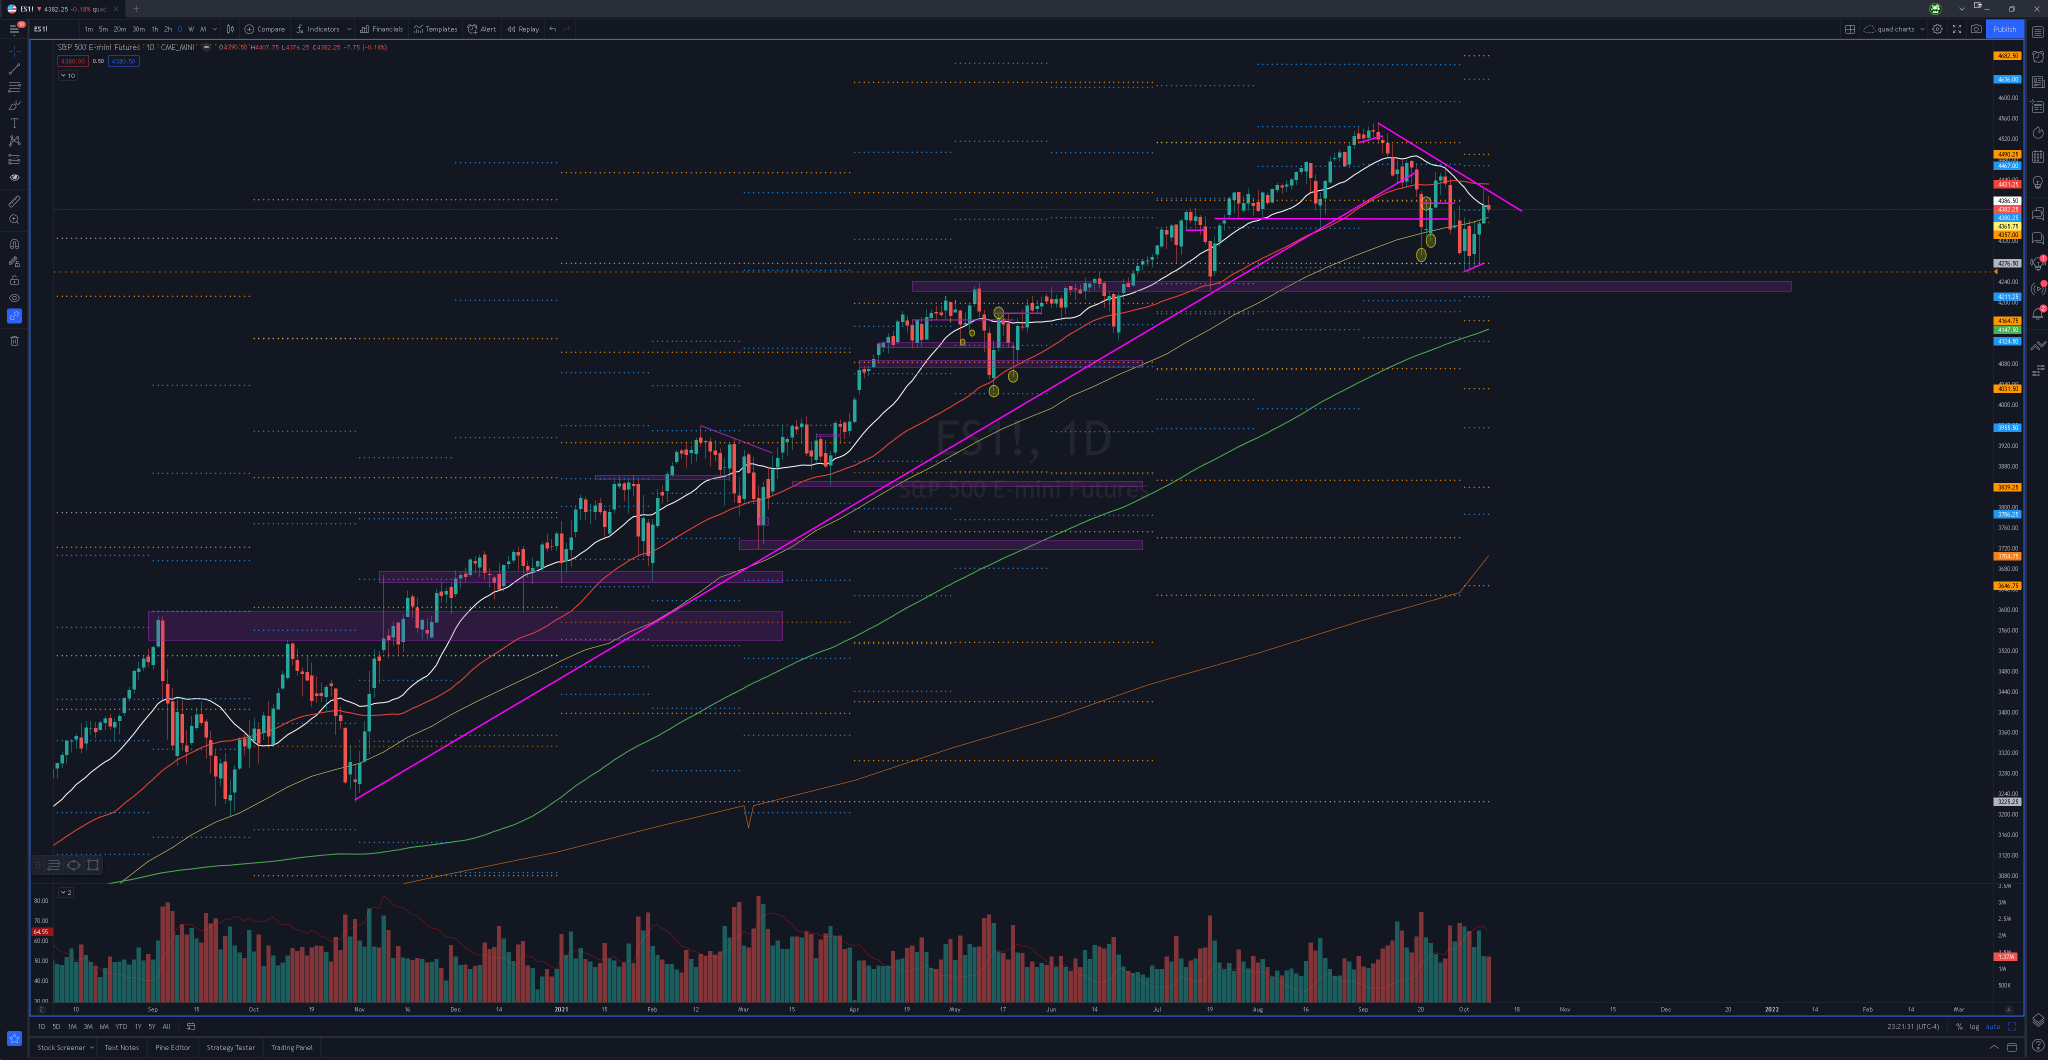
https://www.tradingview.com/x/N27dVKiW/
Now switching to the daily chart, you can see the nuances of what’s happening under the hood. Obviously pops into 20d & 50d are acting as resistance. Until we break above those levels, we may still find a lot of overhead supply on the other names as the market is pushing into these levels. We already kind of rejected the 50d. I’d like to see a pullback and see buyers step in before we test last week’s lows. That 4300 area would be a great area to see pullbacks start to find buyers and see if we can put in some higher lows. But if we come down and test the annual pivot and last week’s lows, I would still expect those levels to act as support.
So pullbacks are still opportunities for me to look to get long on strong names. If we push back above certain levels and then if we start to pullback and base, then I will start to look for even more bullish setups. If for whatever reason we extend straight up without really having any major pullback, maybe into 4470 (monthly pivot & recent congestion on the daily chart). Then I will look for shorting names that are extended and those which are pushing into levels of resistance. Right above that you have a quarterly pivot at 4490 and the 4500 psychological levels.
$NQ / $QQQ
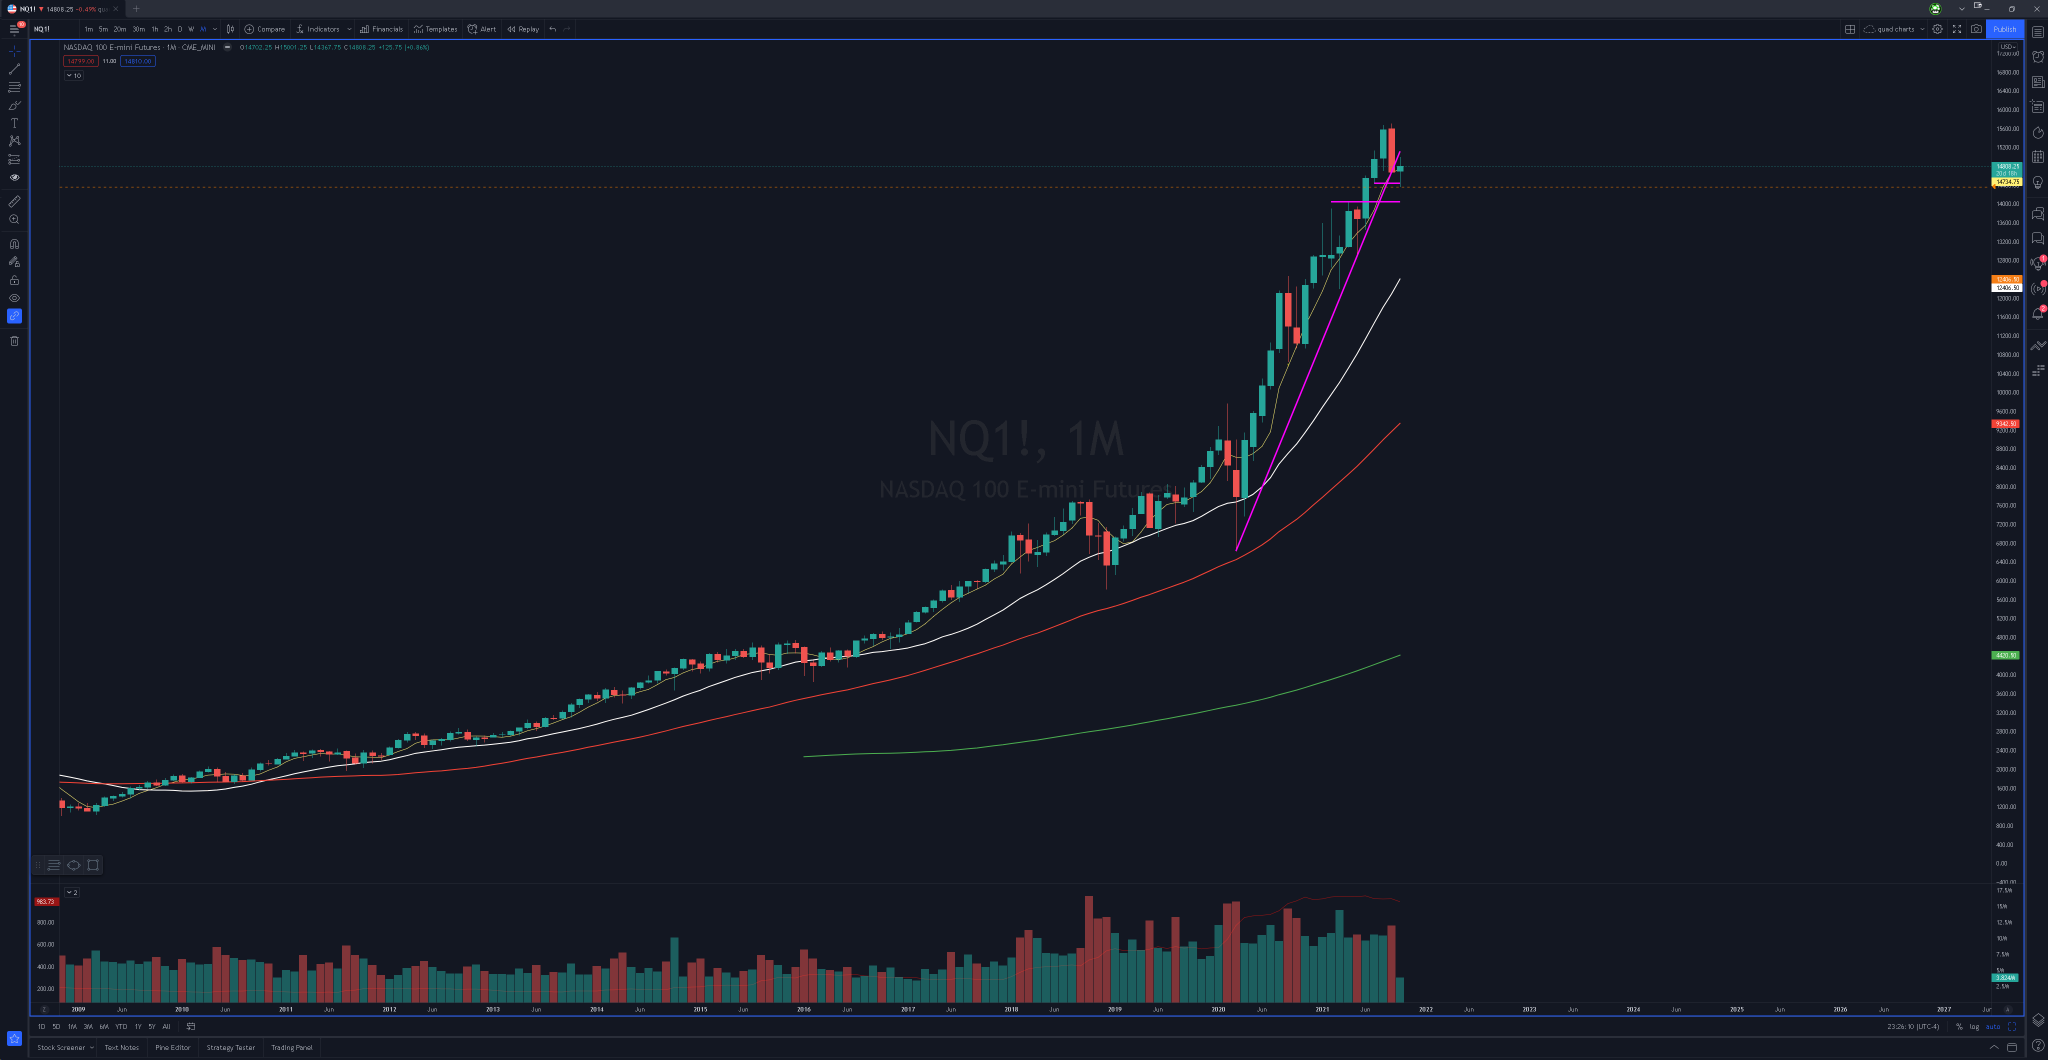
https://www.tradingview.com/x/96vTOI6m/
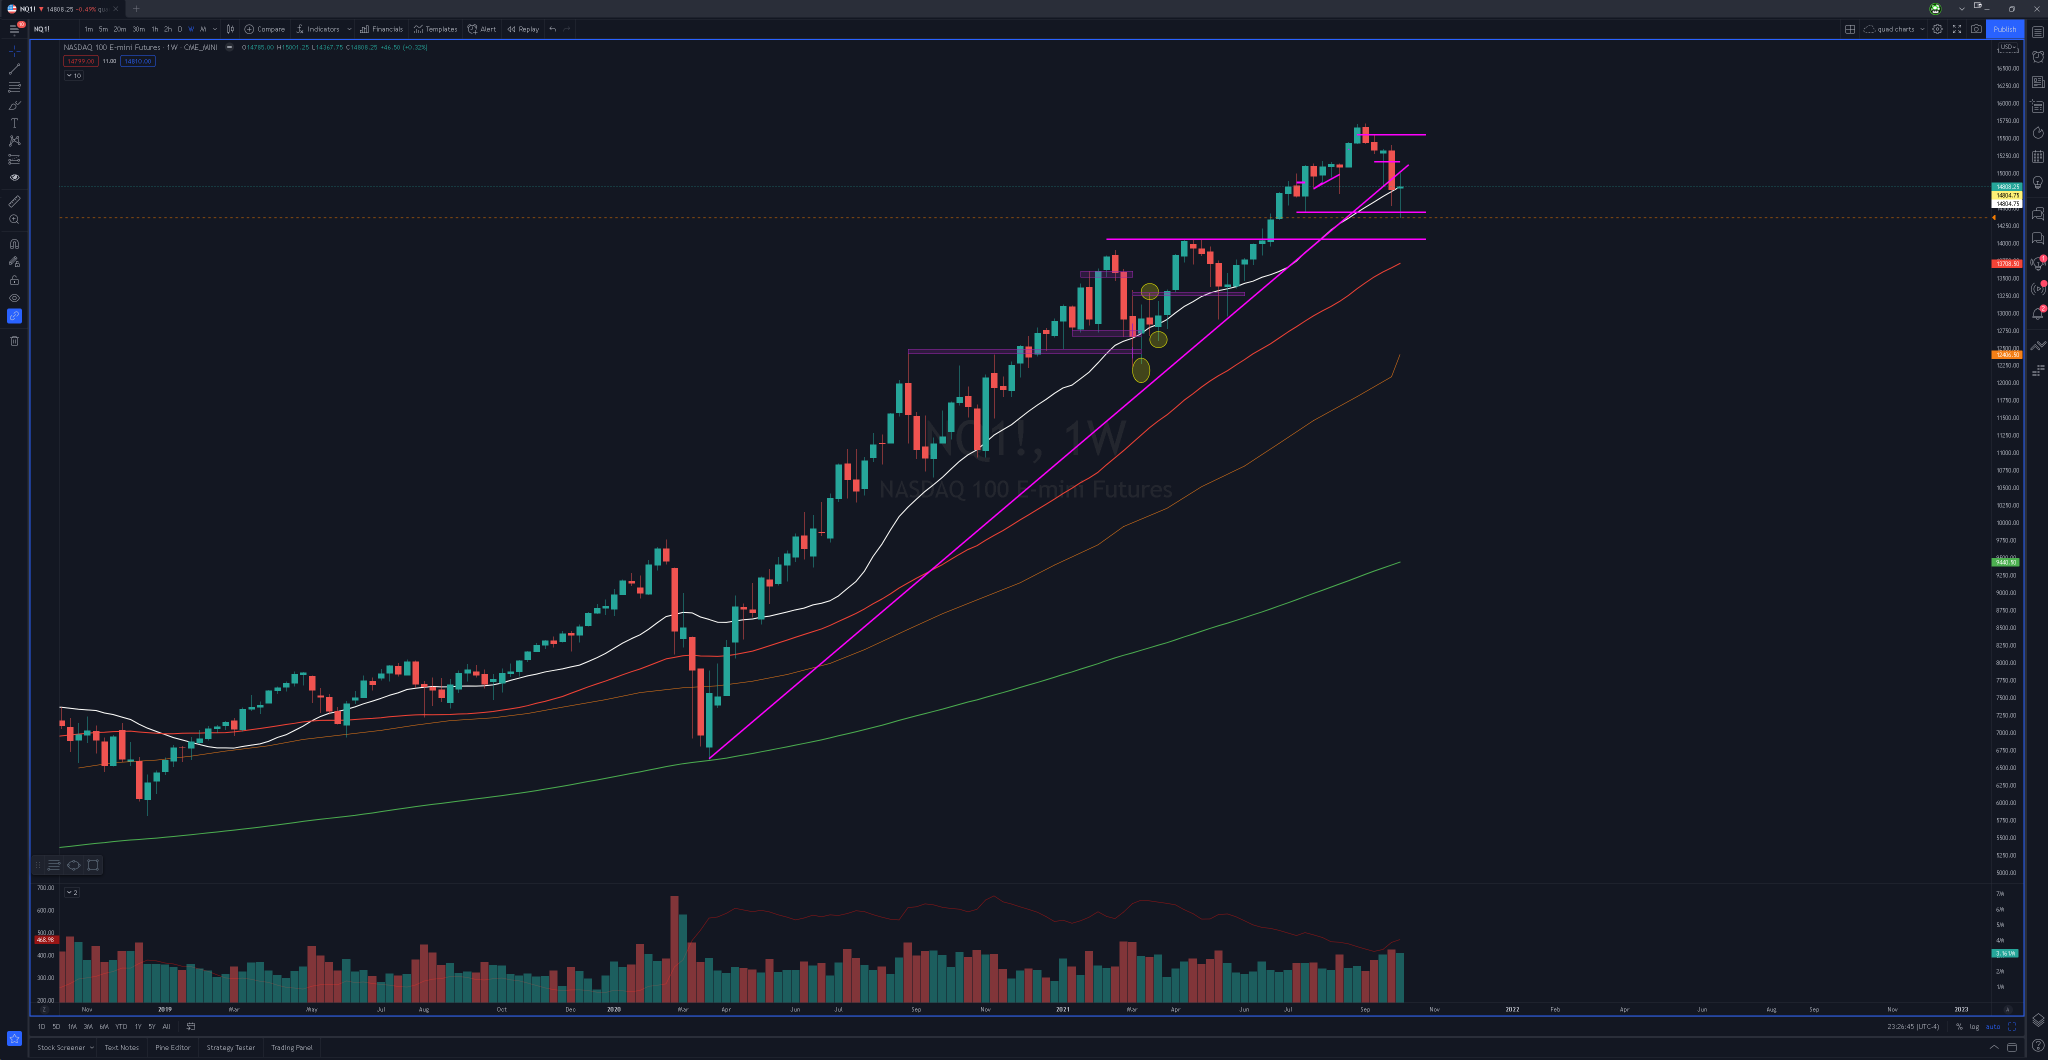
https://www.tradingview.com/x/0SvgJXHs/
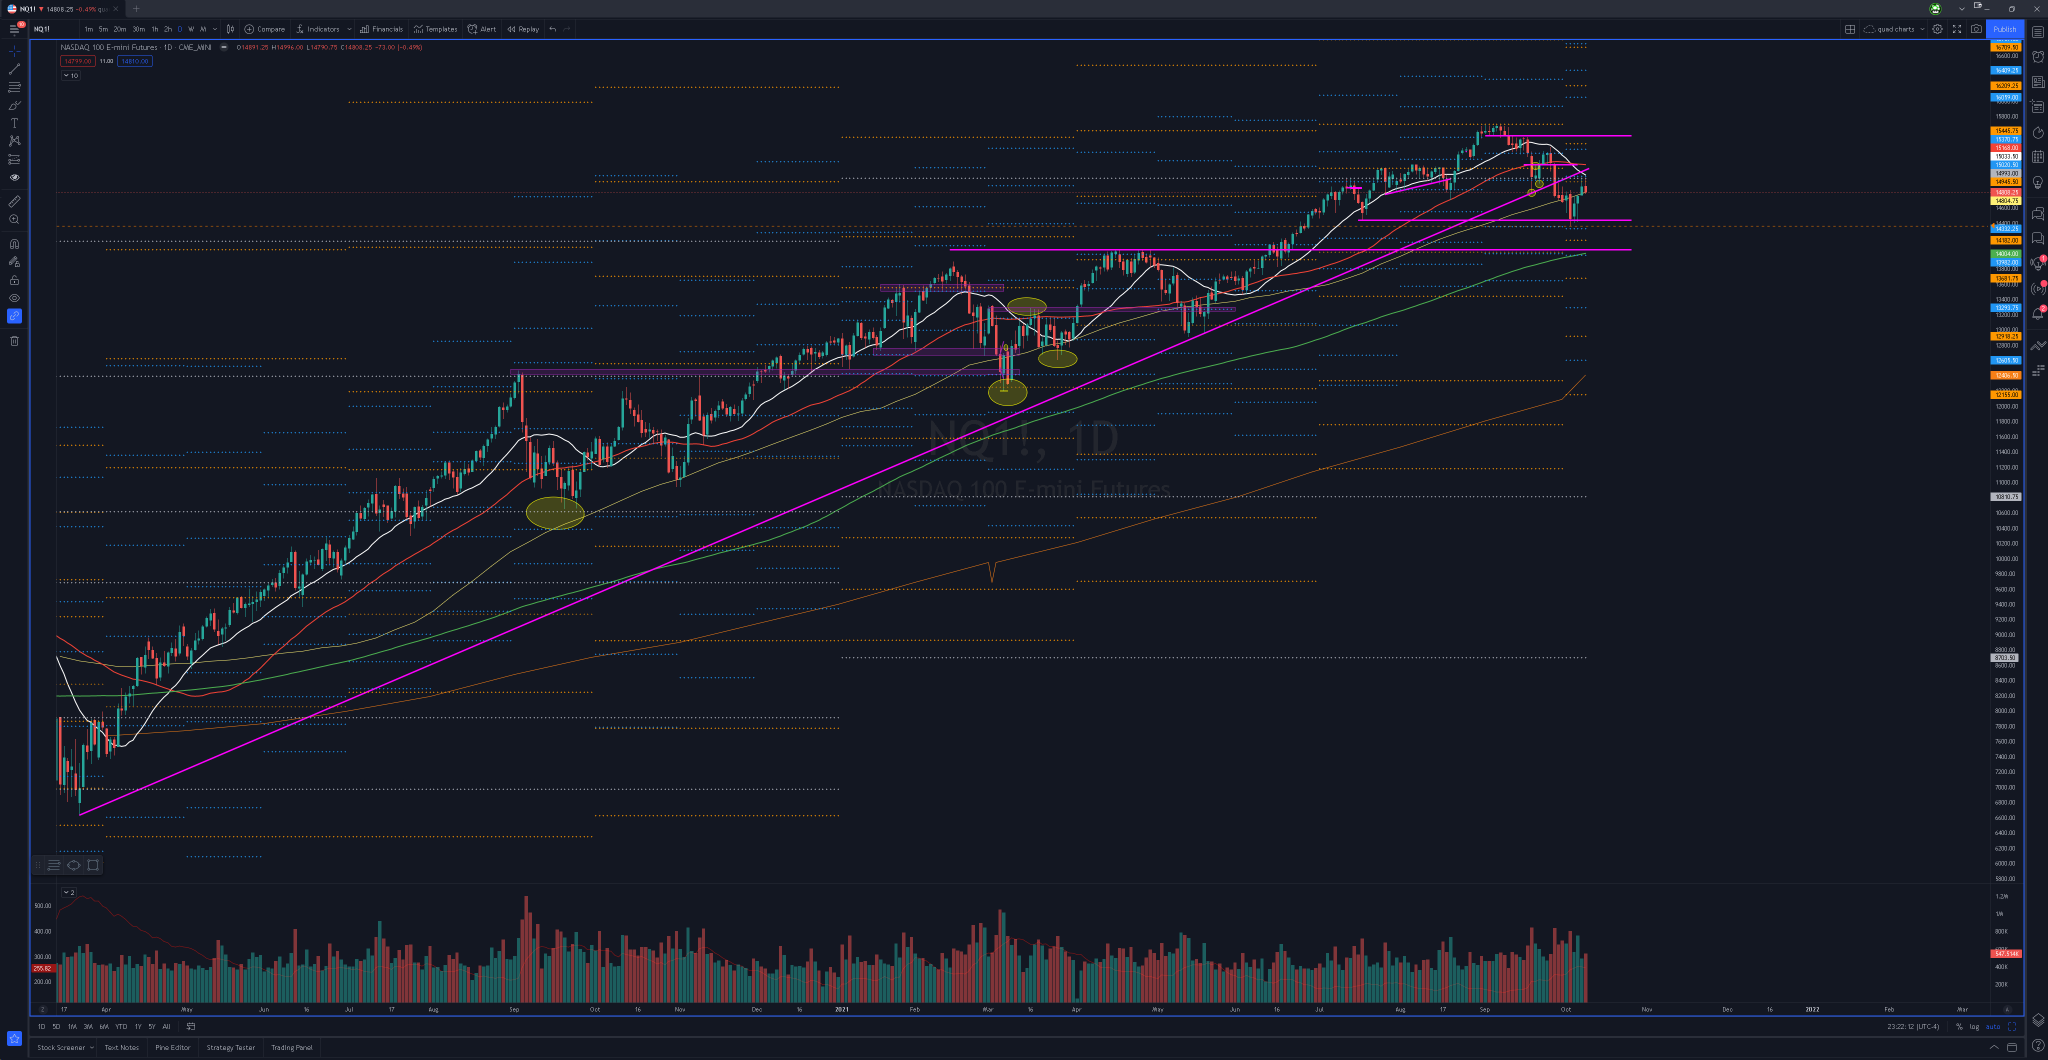
https://www.tradingview.com/x/egqeQIQo/
This chart obviously looks very similar to the $ES. We briefly breached the 14400 level but quickly reclaimed it. But since then the push back into the underside of the 20d have shown strong resistance. And is it really any surprise? You have the quarterly/annual/monthly stacked pivots all in that same area as well as the psychological 15k level. What I would like to see is a pullback, put in higher lows and then a push back above 15k. If we can do that, then I would look to see if there’s some follow through on Tech names. If we start to lose the recent lows, then I will start to look for lower highs and possibly some short setups. If we blast through 15k without any real from the bears then I would be looking at the monthly pivot at 15370 and quarterly at 15445 as areas where I would expect to act as near-term resistance. Above that we have this 15500s level, from where the selling started.
$BTC
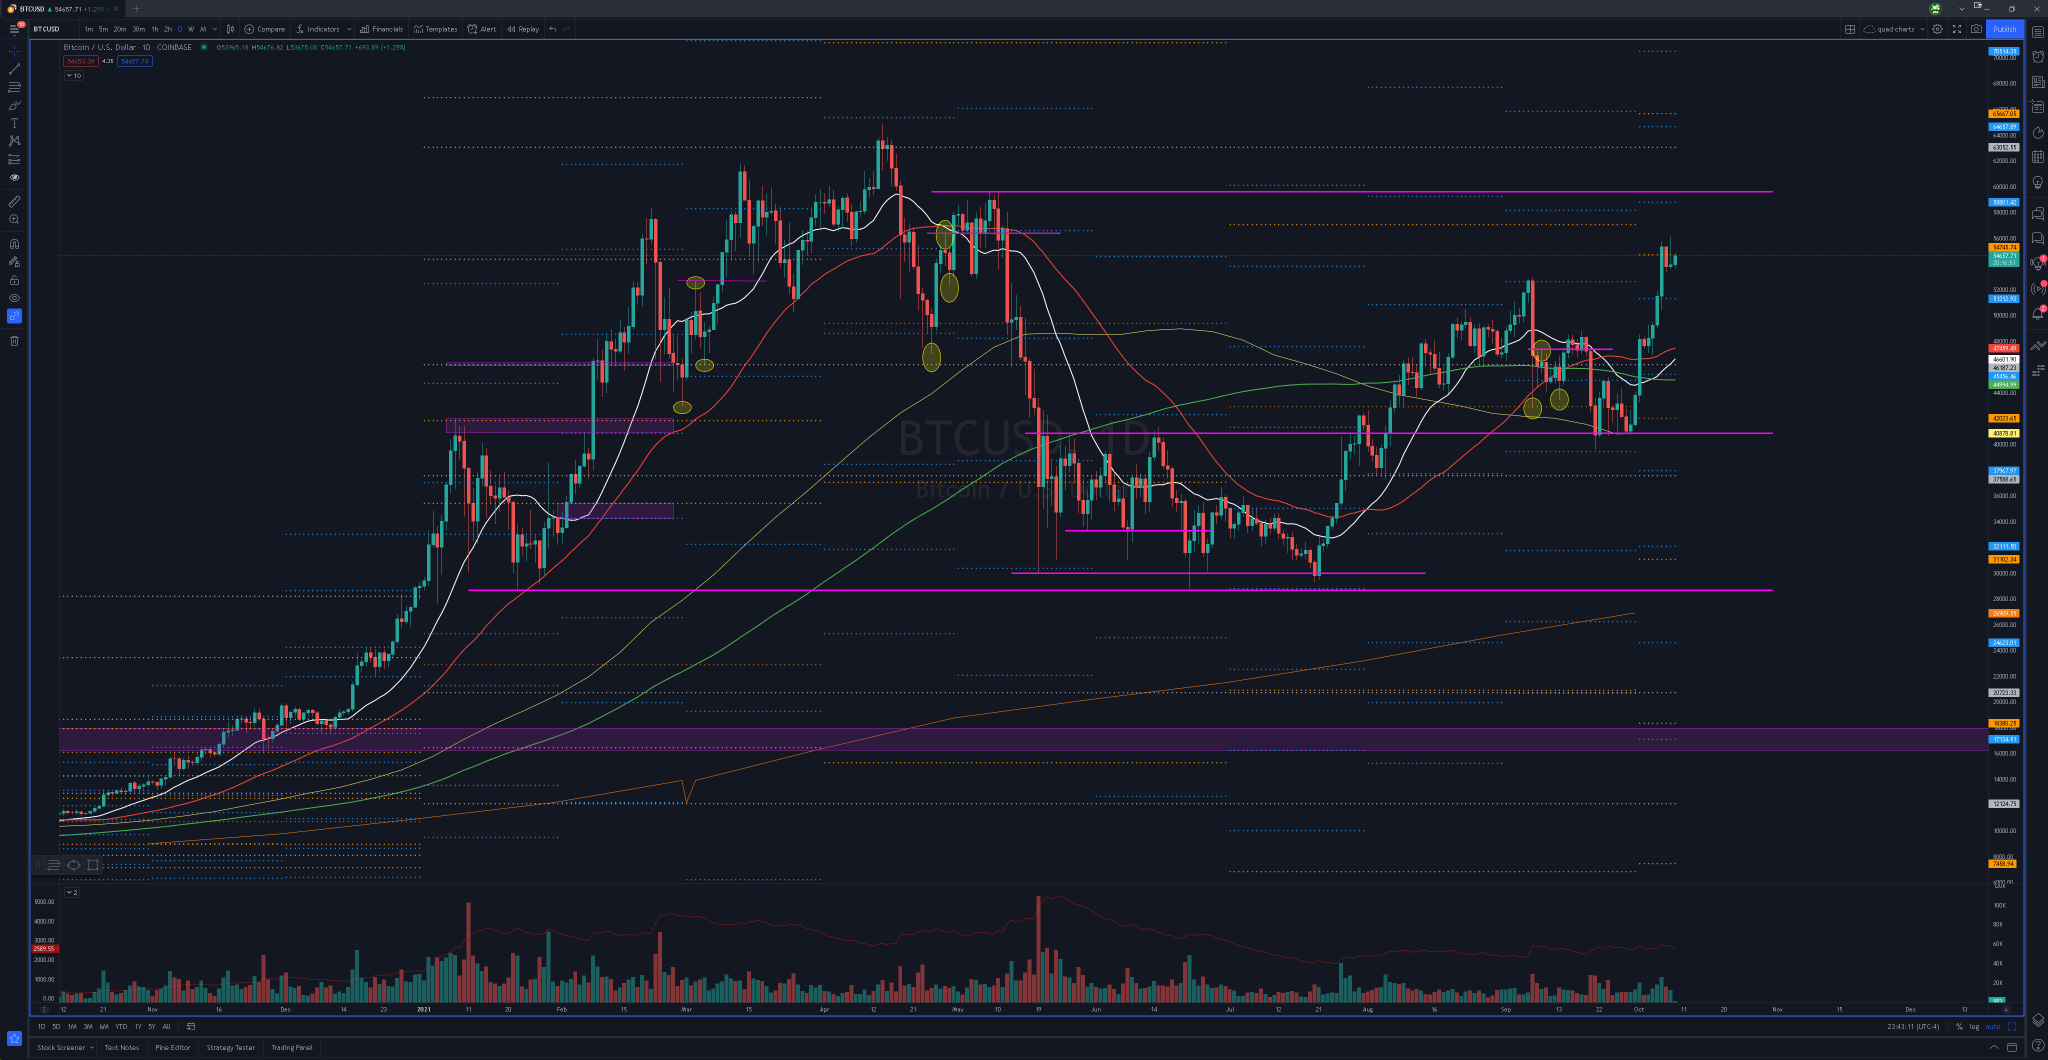
https://www.tradingview.com/x/aqSc6jEl/
Everything looks well intact, we got straight through that 53k level without any real challenge at all. Even when it did rollback, it retested that level and held. I think the next logical area is gonna be 59k to 60k. 60k is gonna be a large psychological level, after that we have ATHs. Everything looks good on the crypto space, keep watching for when we have pullbacks if we start to put in the higher lows or do we actually come lower on some levels. I really can’t help but just always admire the way the crypto space obeys technical levels so well.
One thing that I keep looking at is how bullish the weekly chart looks if we start getting back over ATHs. People that are scoffing at the idea of a push to 100k may look silly if they can’t put their egos aside and realize that it might be a possibility. If you chop these bigger numbers down to more easily digestible numbers, you realize that it would be no different than a $6 stock going to $10. It’s still a big move, but it definitely isn’t unfathomable. But keep in mind, that isn’t the kind of move I expect to happen overnight either. It would most likely be a long process.
SECTOR ANALYSIS
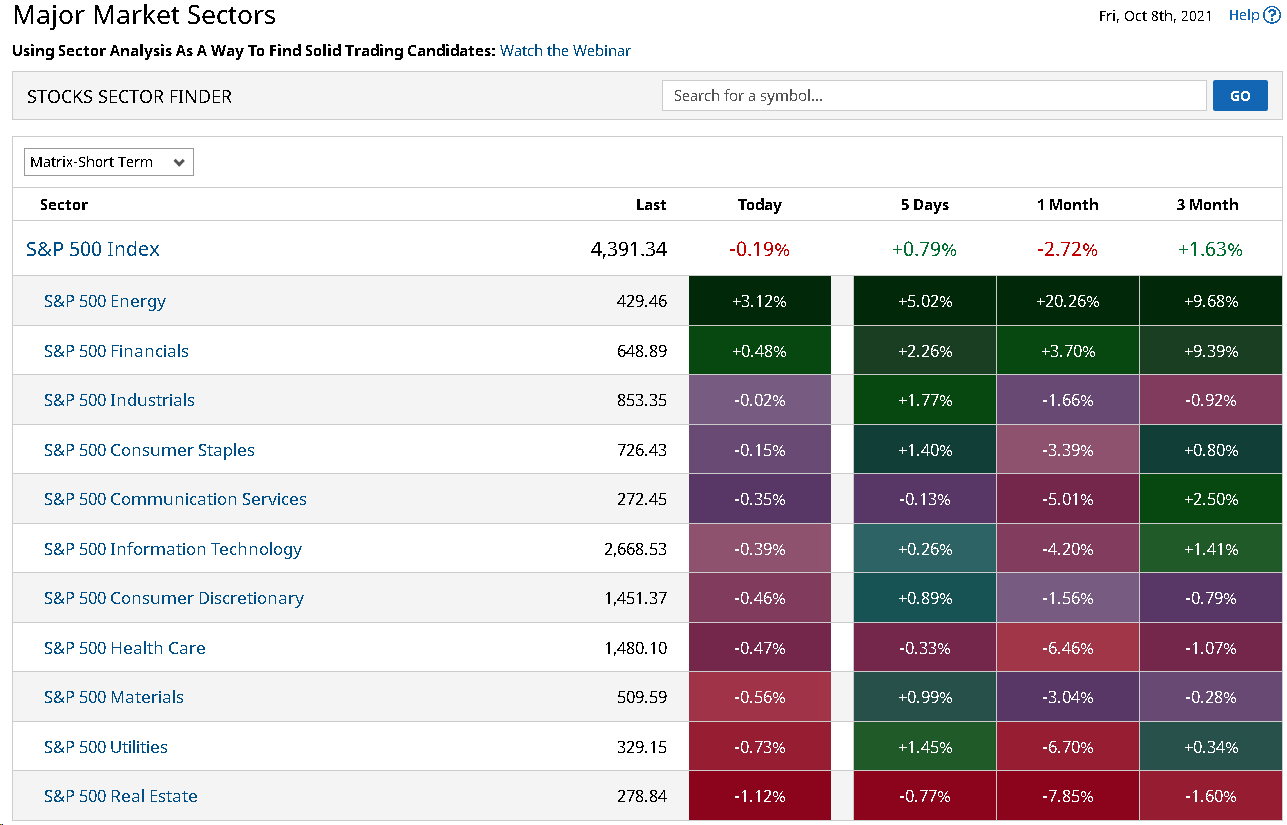
$XLE
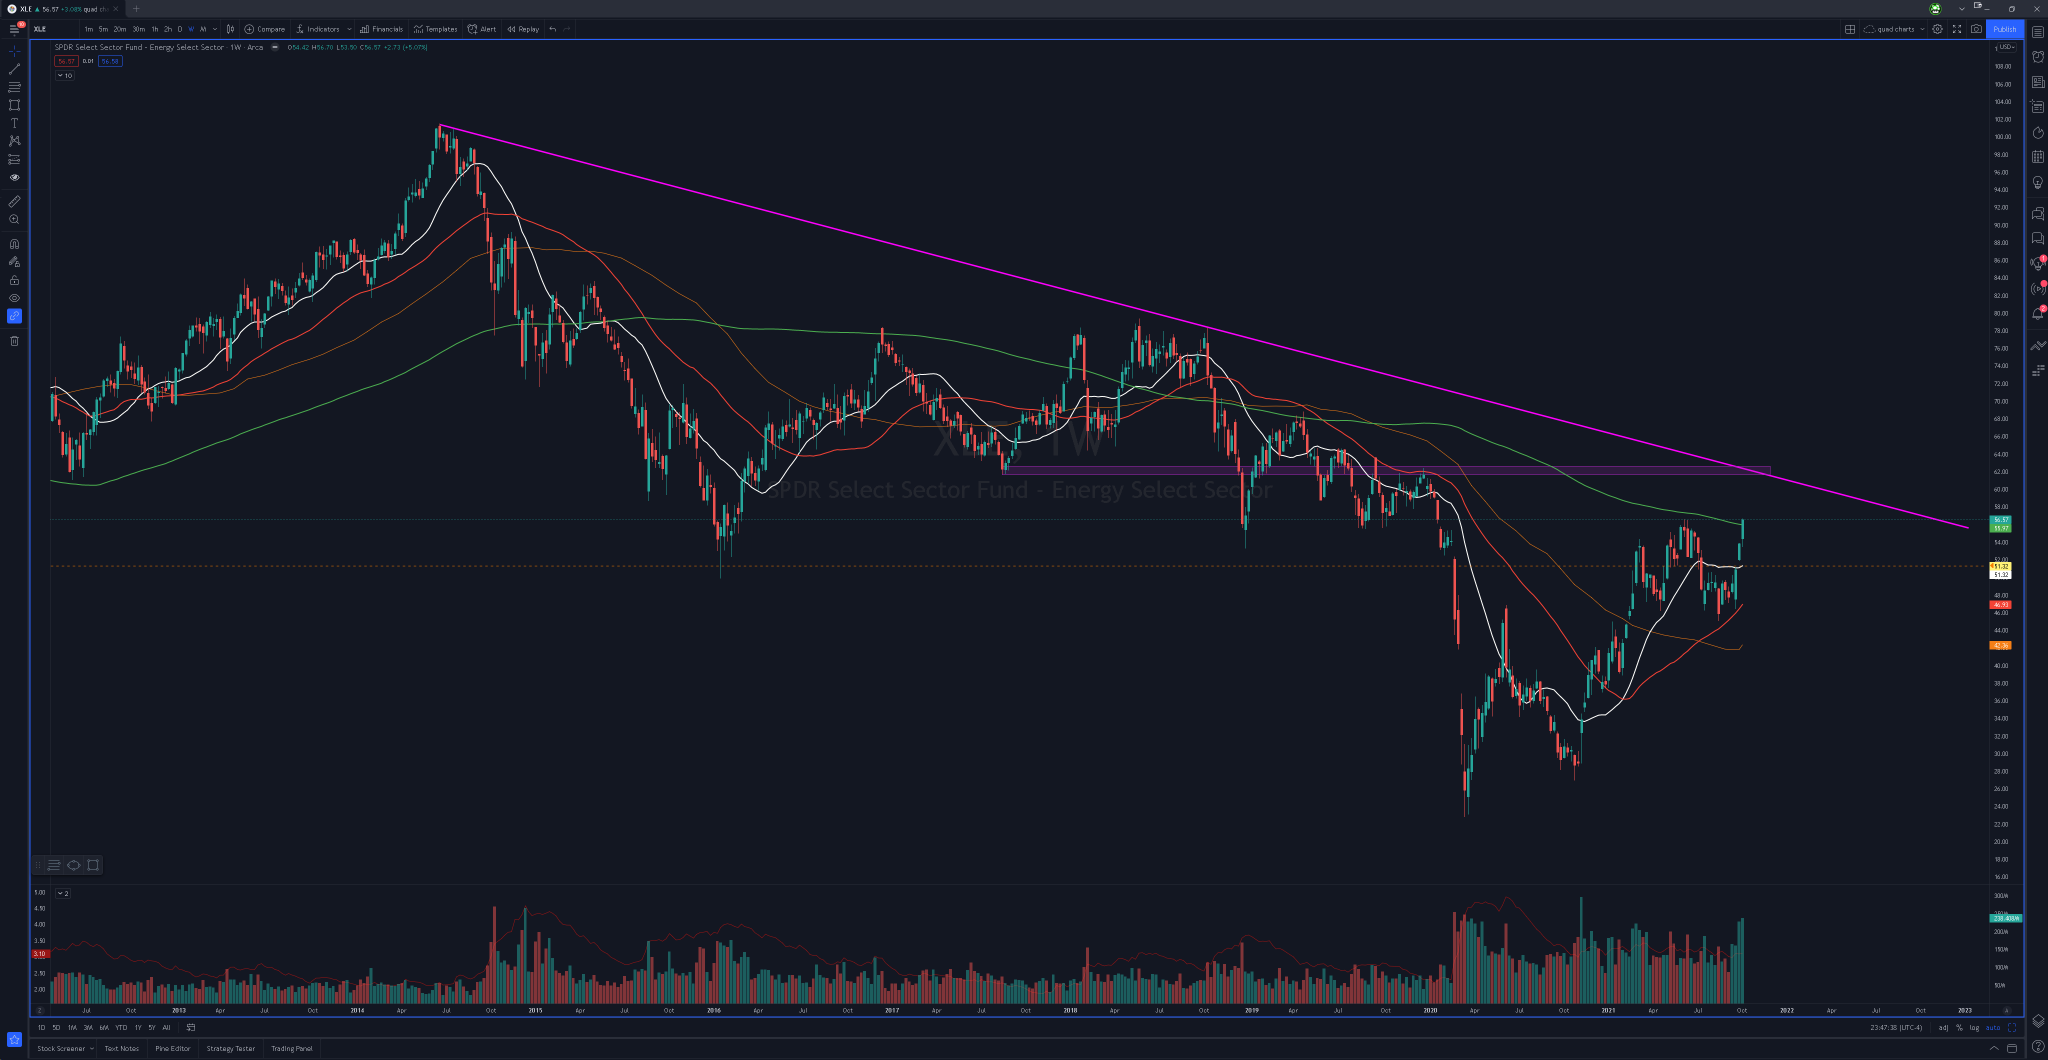
https://www.tradingview.com/x/maJBg9L4/
Energy remains super strong and I still think it has the potential for more upside. You can see on $XLE that the 62 area is where I think some resistance shows up. But if we pull back ahead of that, I still like the buying opps down around 51-52 (20d).
$XLF
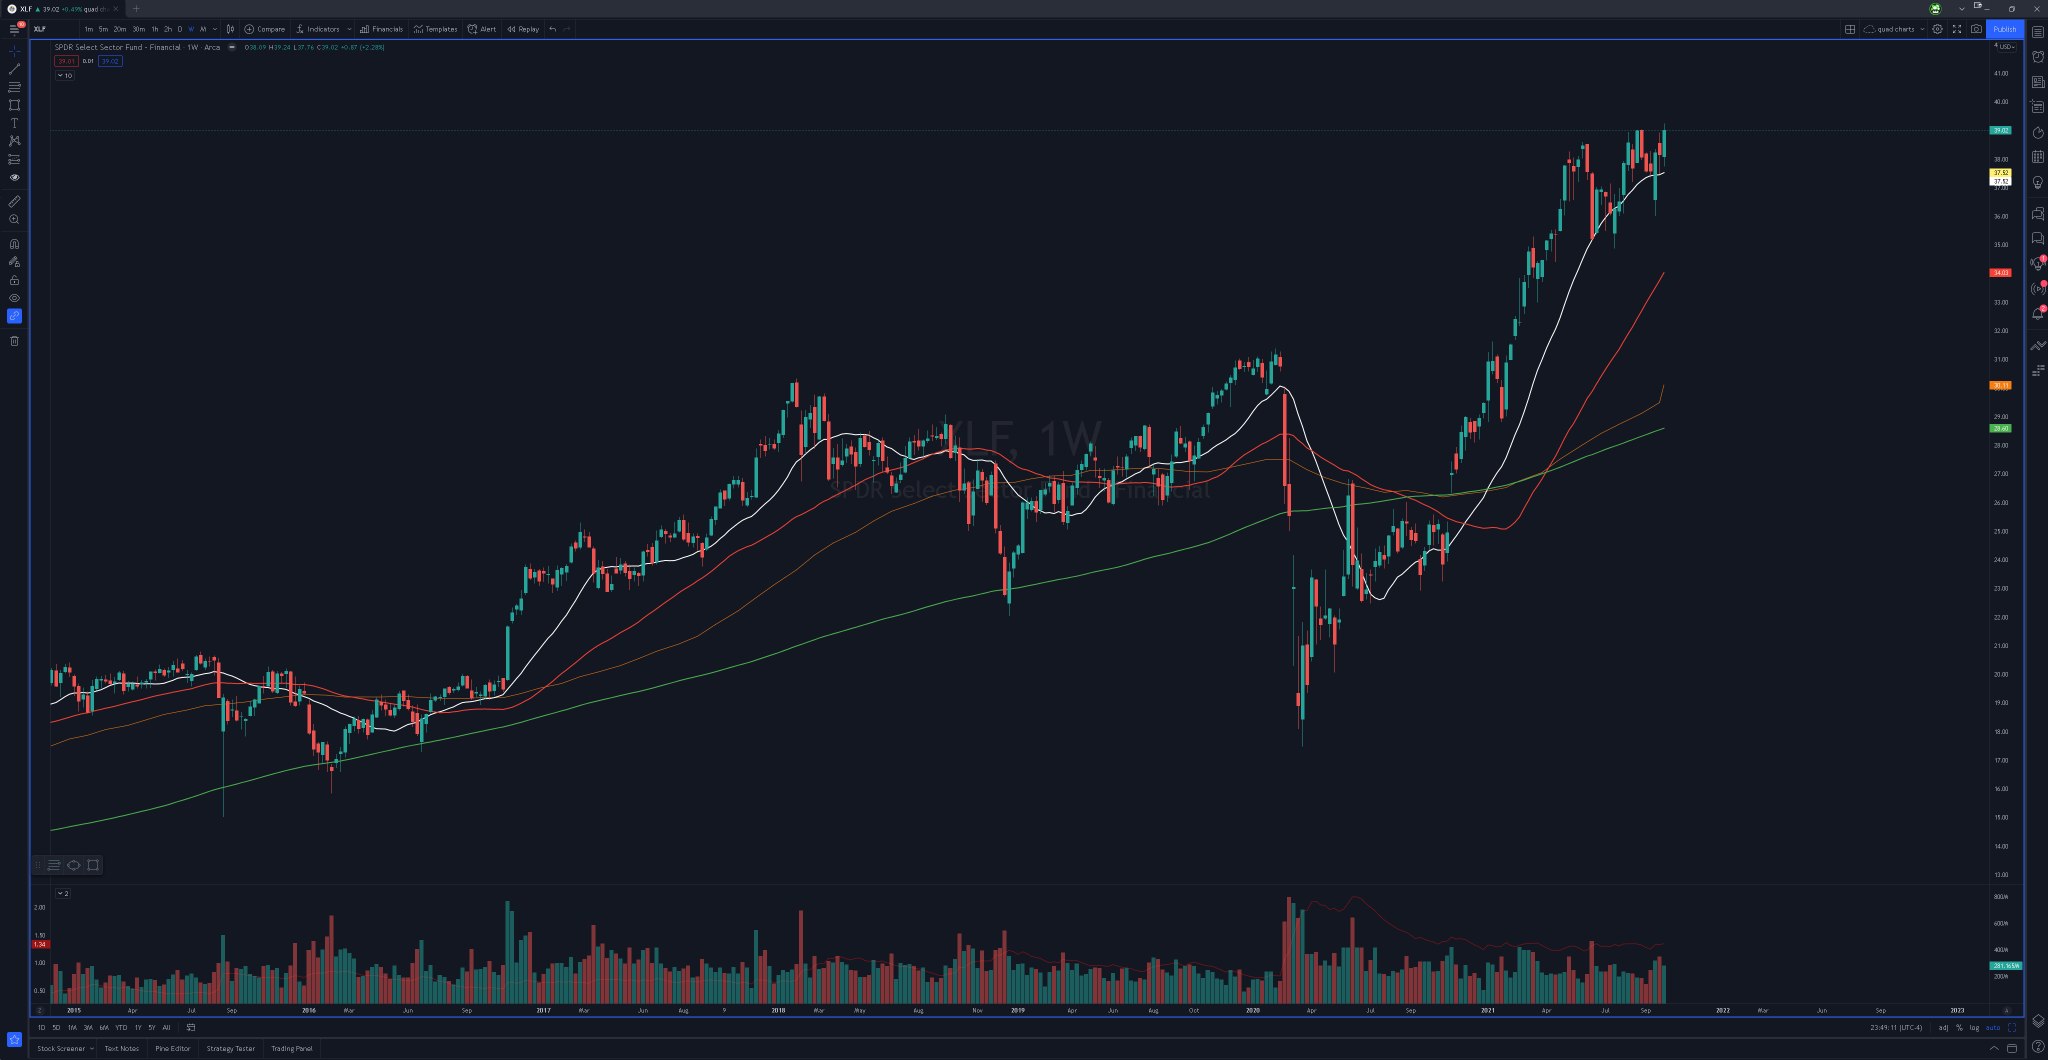
https://www.tradingview.com/x/Ggkemyr2/
Financials still look extremely strong as well, making higher lows and higher highs. Pullbacks can very well offer long opportunities. We also may get some extension on it, since we just broke out. Depends on the overall market though, but the weekly chart looks great on this.
$XLK
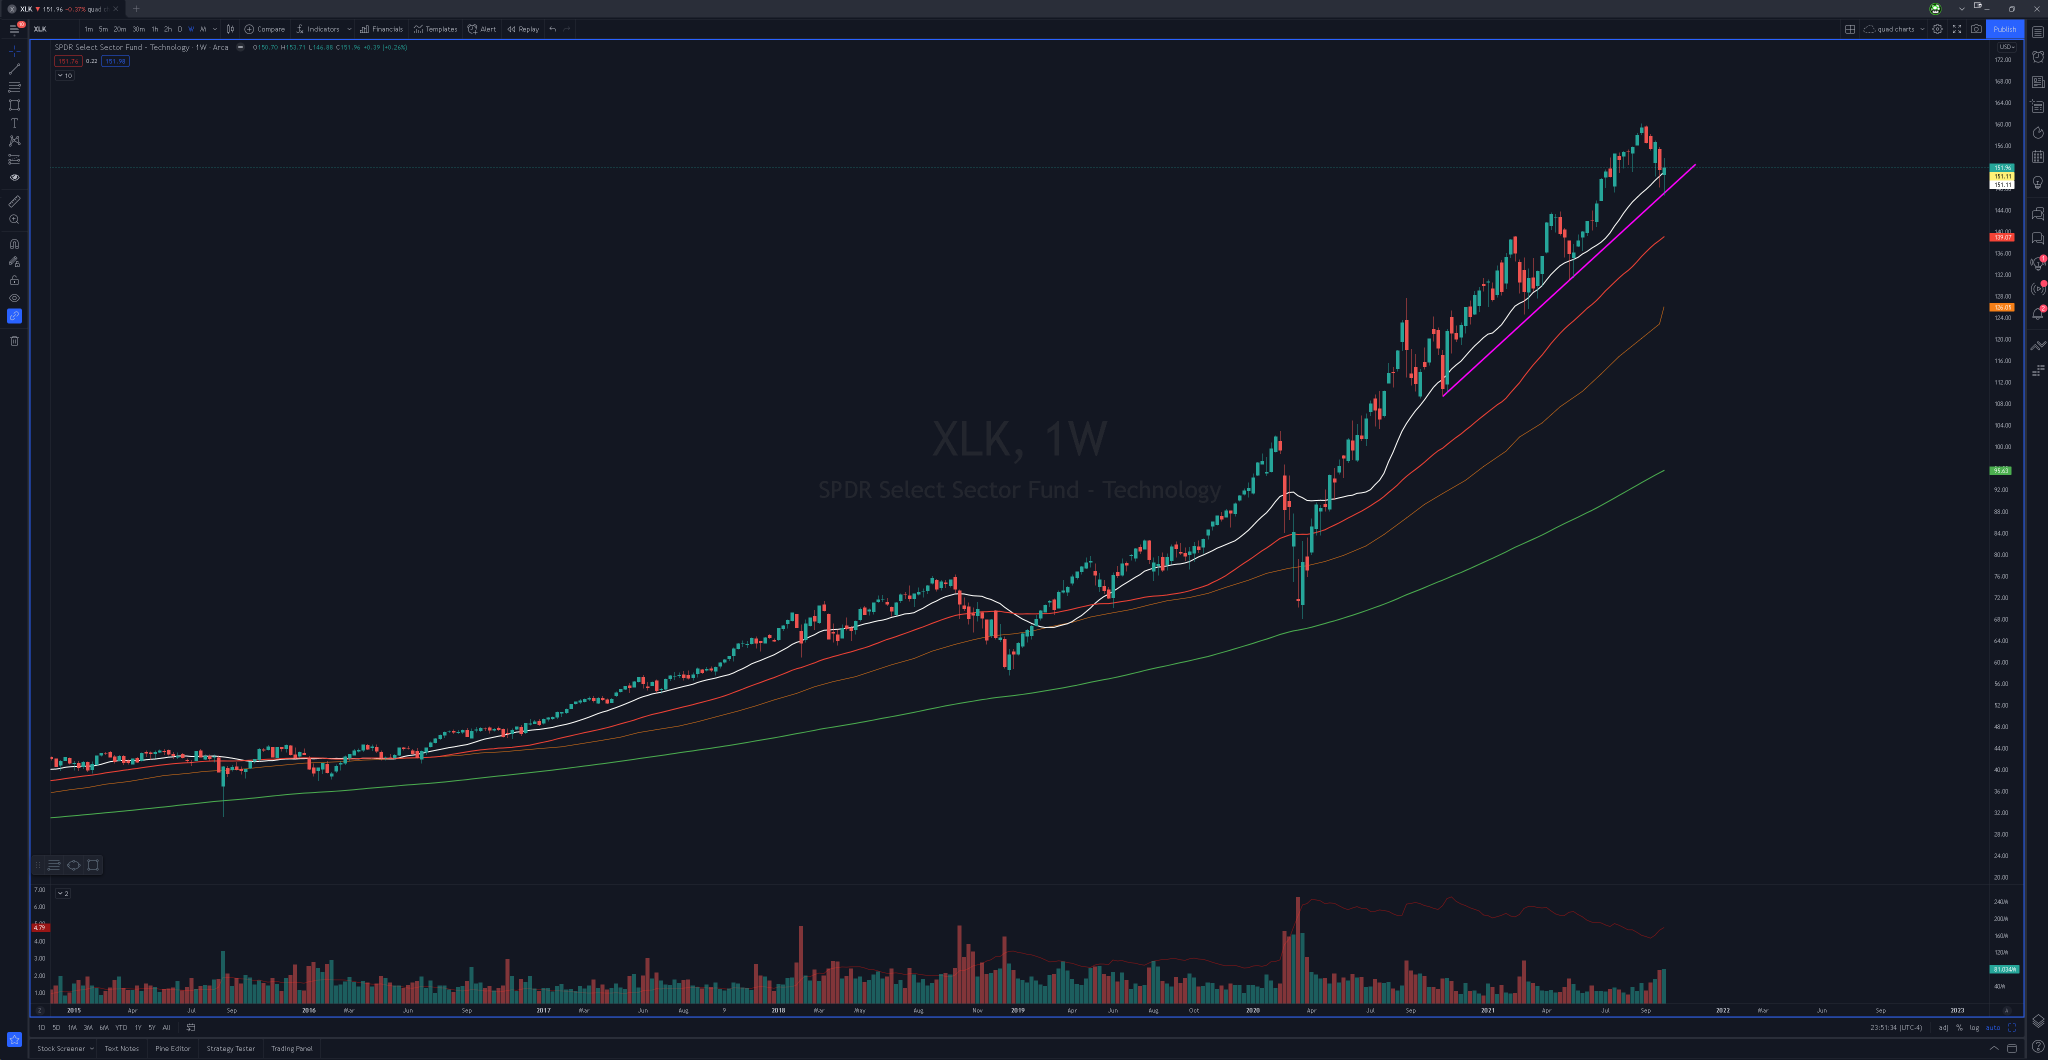
https://www.tradingview.com/x/hN589rln/
Tech has pulled back to areas of support and I will be watching to see if the recent lows hold from here. If they can, we may be able to put in a nice base here and have the potential for some nice longs in the sector.
LONG SETUPS
STRONG STOCKS – CONTINUATIONS
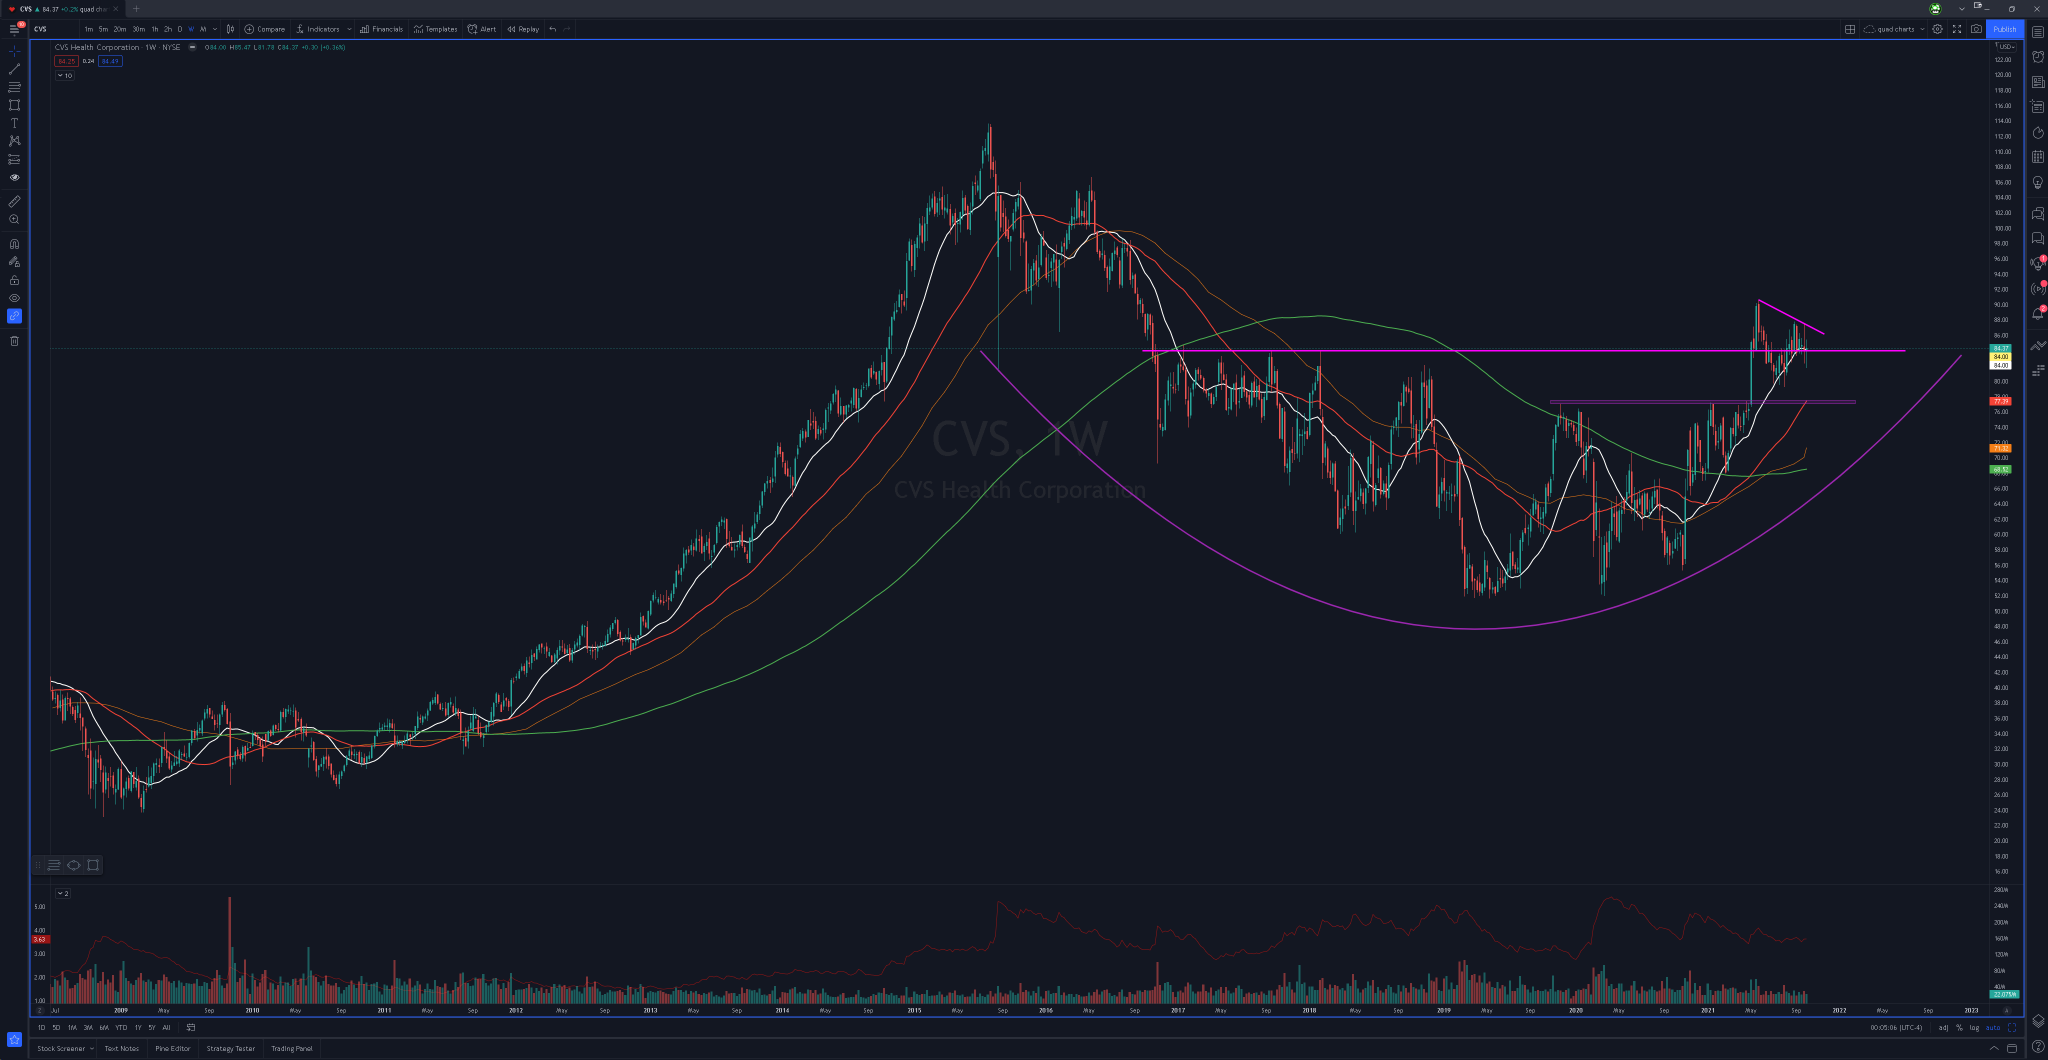
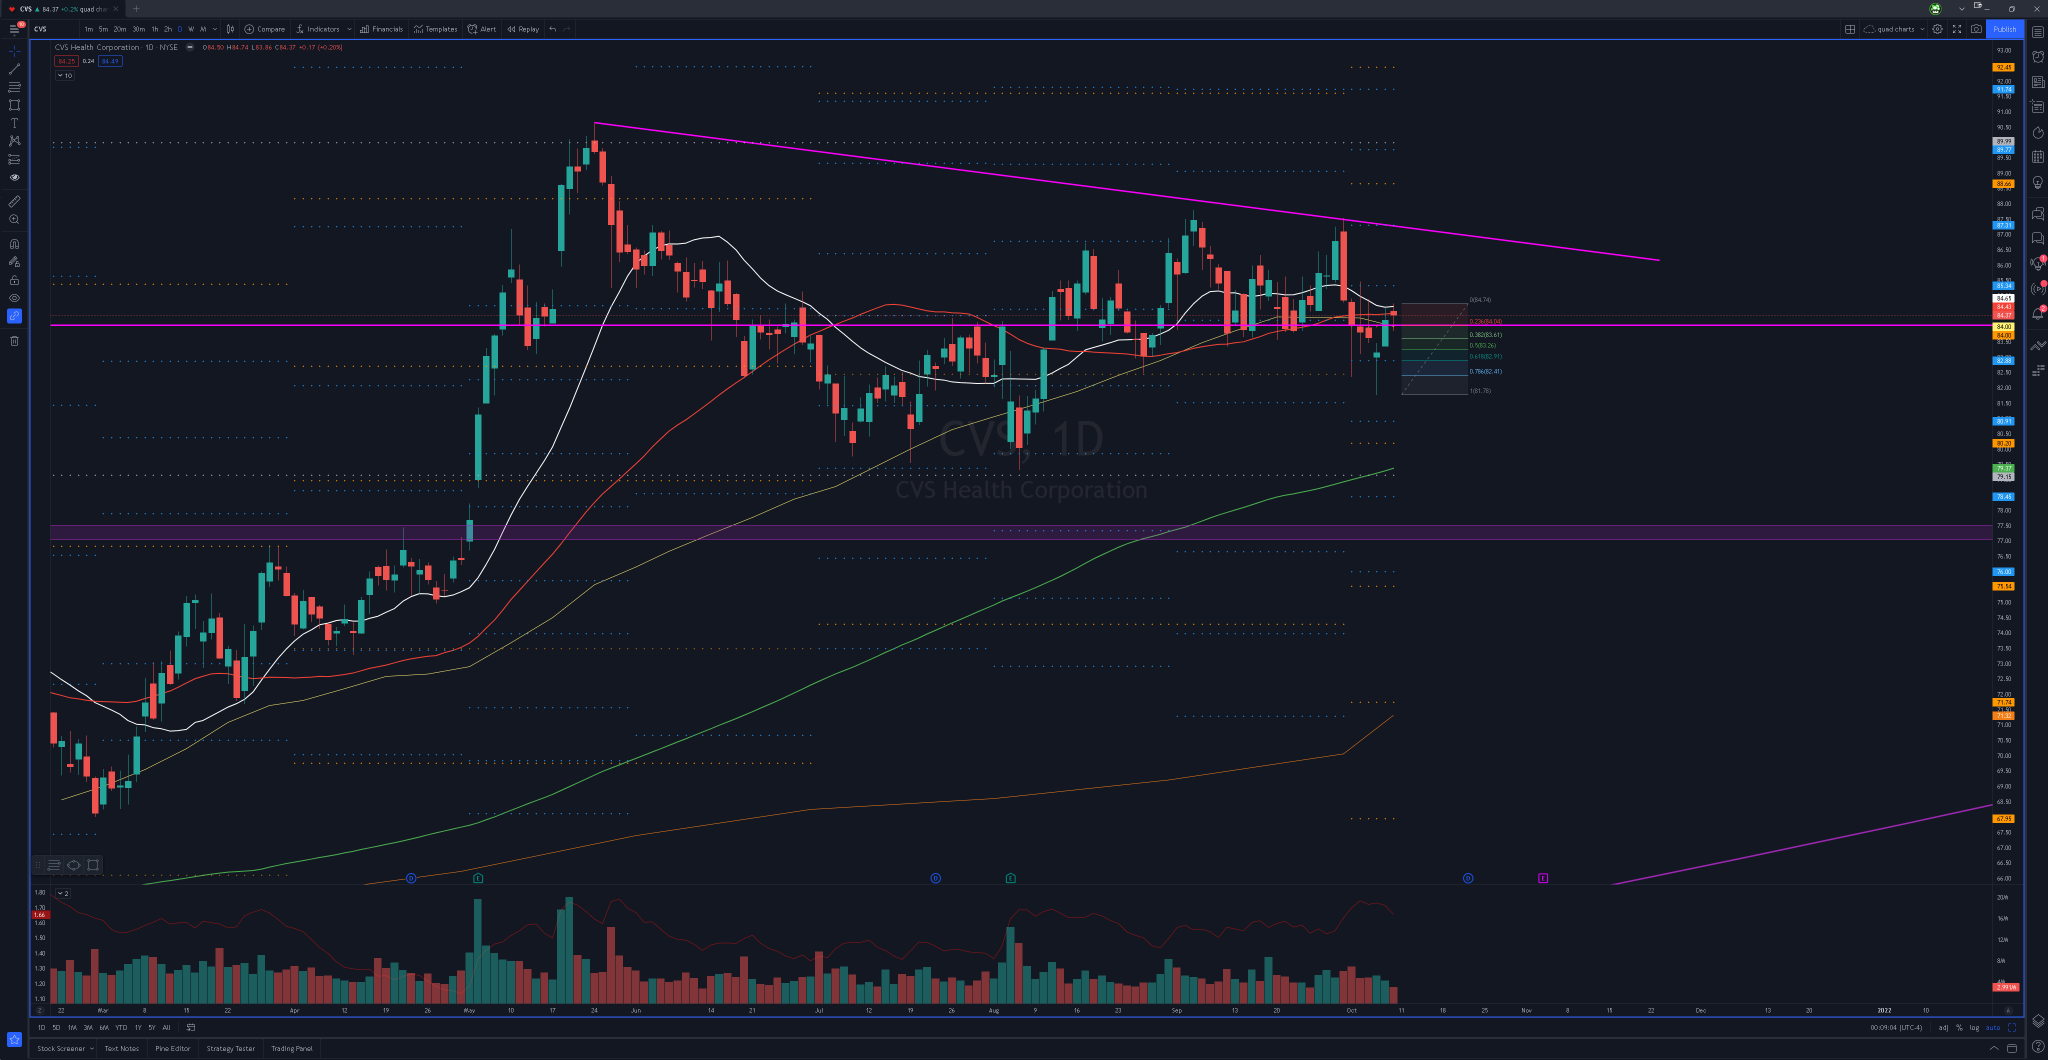
$CVS
https://www.tradingview.com/x/qHP3pXCk/
https://www.tradingview.com/x/W9W9ySYg/
Still really like this weekly chart for a swing. Reminds me a lot of the $DISH chart with the big cup and handle forming. Just trying to position in there on dips so that if this decides to start making that push I can scale into the swing. Looking for a weak open and scoop opp around 82.9 which is close to the monthly pivot and the 61.8% retrace from the recent push into the underside of the 20d.
$DDOG
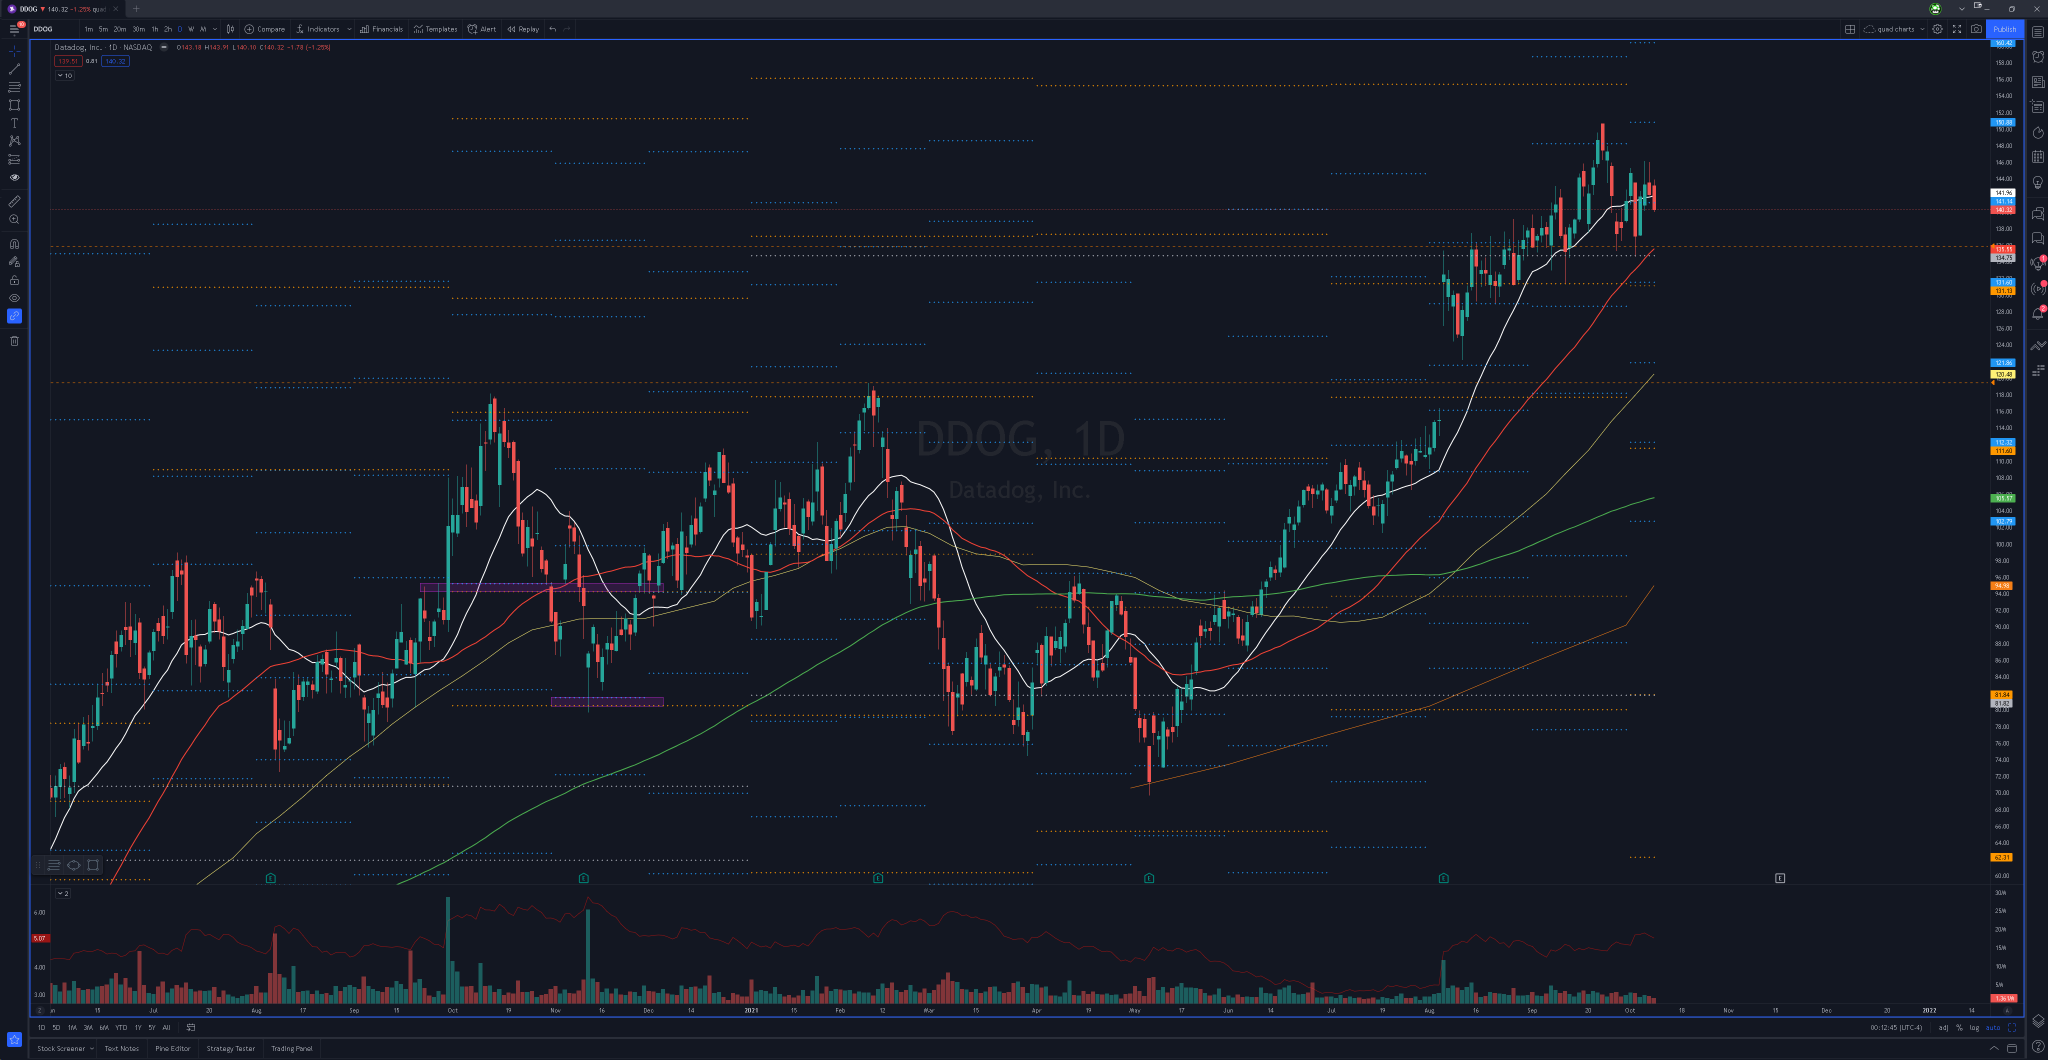
https://www.tradingview.com/x/uF7EyZPg/
Like this name a lot and think that the 50d/annual pivot area around 135 offers a high probability area to scoop for a bounce. I like the range on this name and I like that it respects a lot of the levels really well.
$XENE
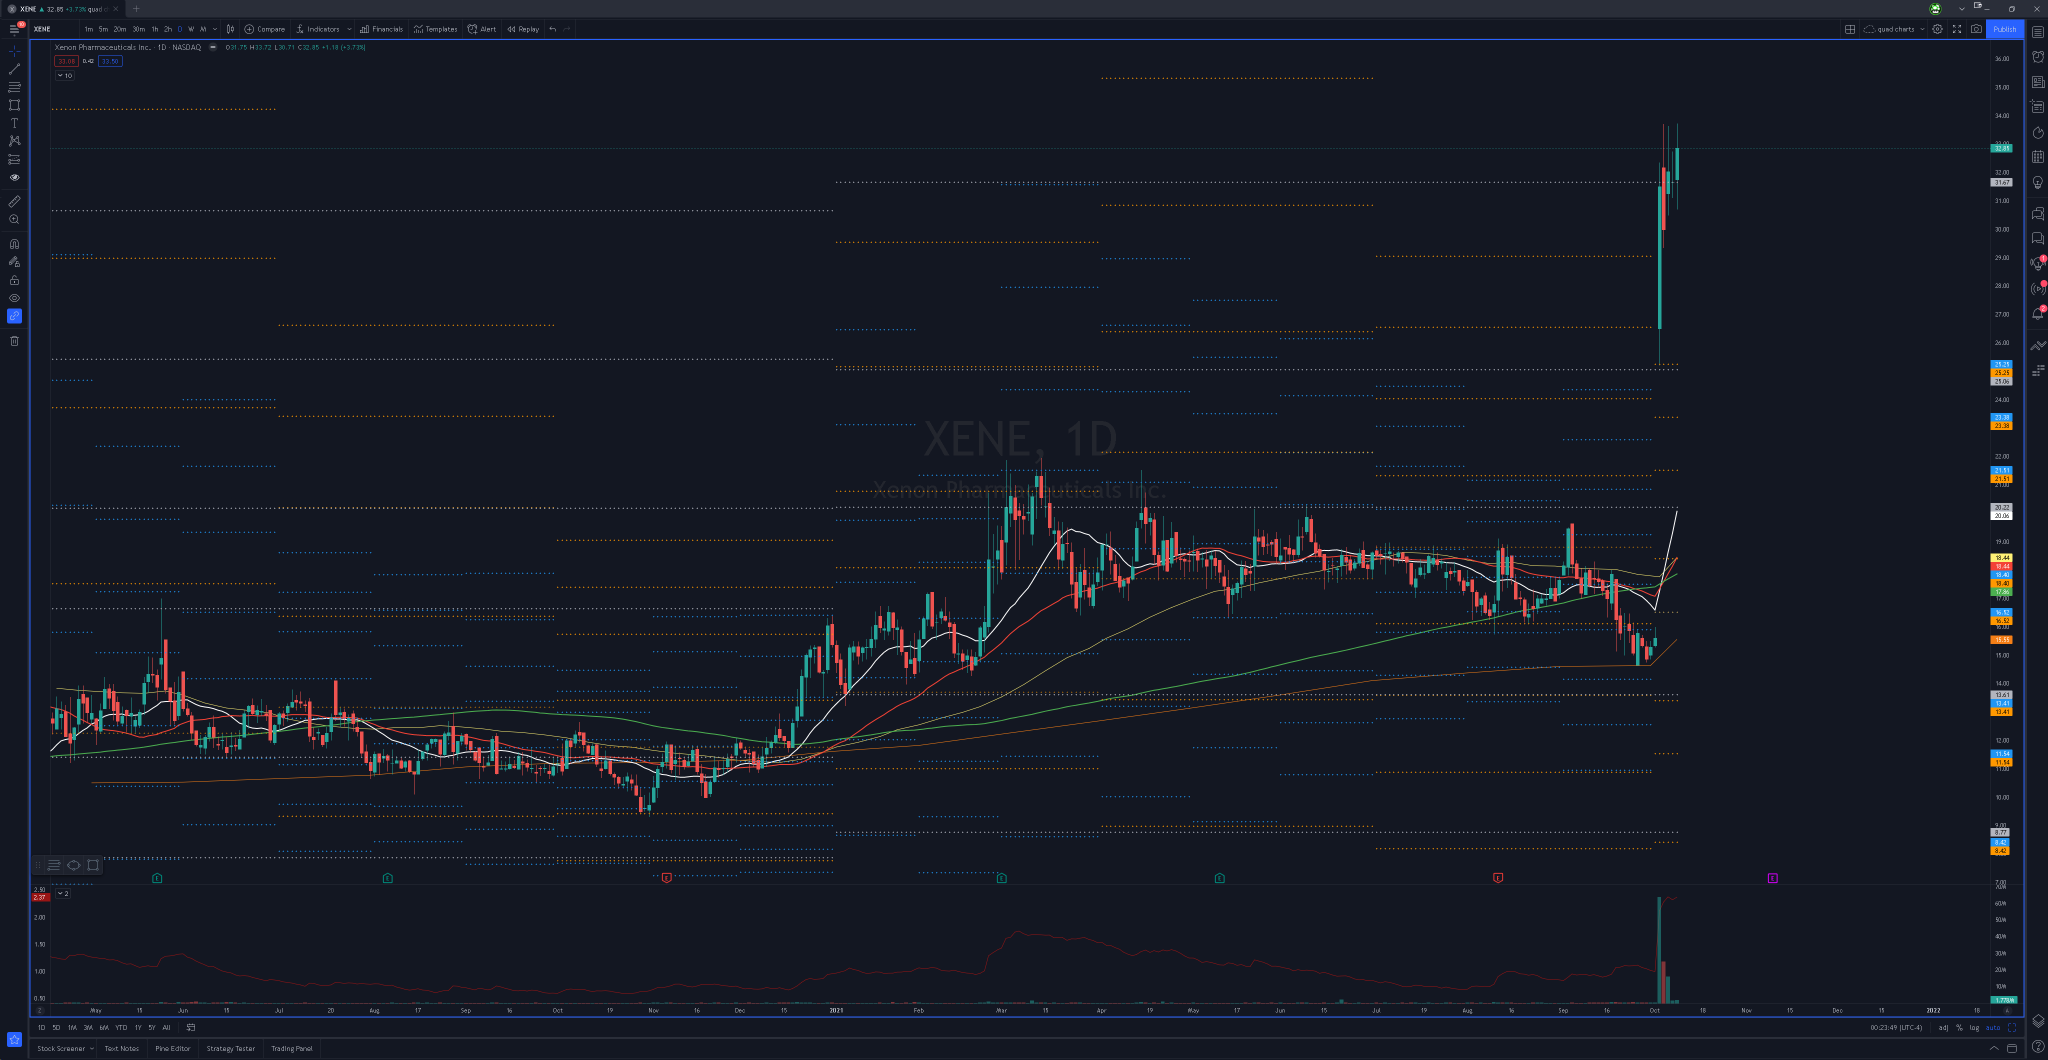
https://www.tradingview.com/x/gPeLQD3K/
Just want to see if early weakness into mid 31s-32 starts to hold as support. If it does and the volume isn’t dismal, I may look to scoop in anticipation of an eventual push back over 33.7 to send a bunch of shorts scrambling.
$AMD
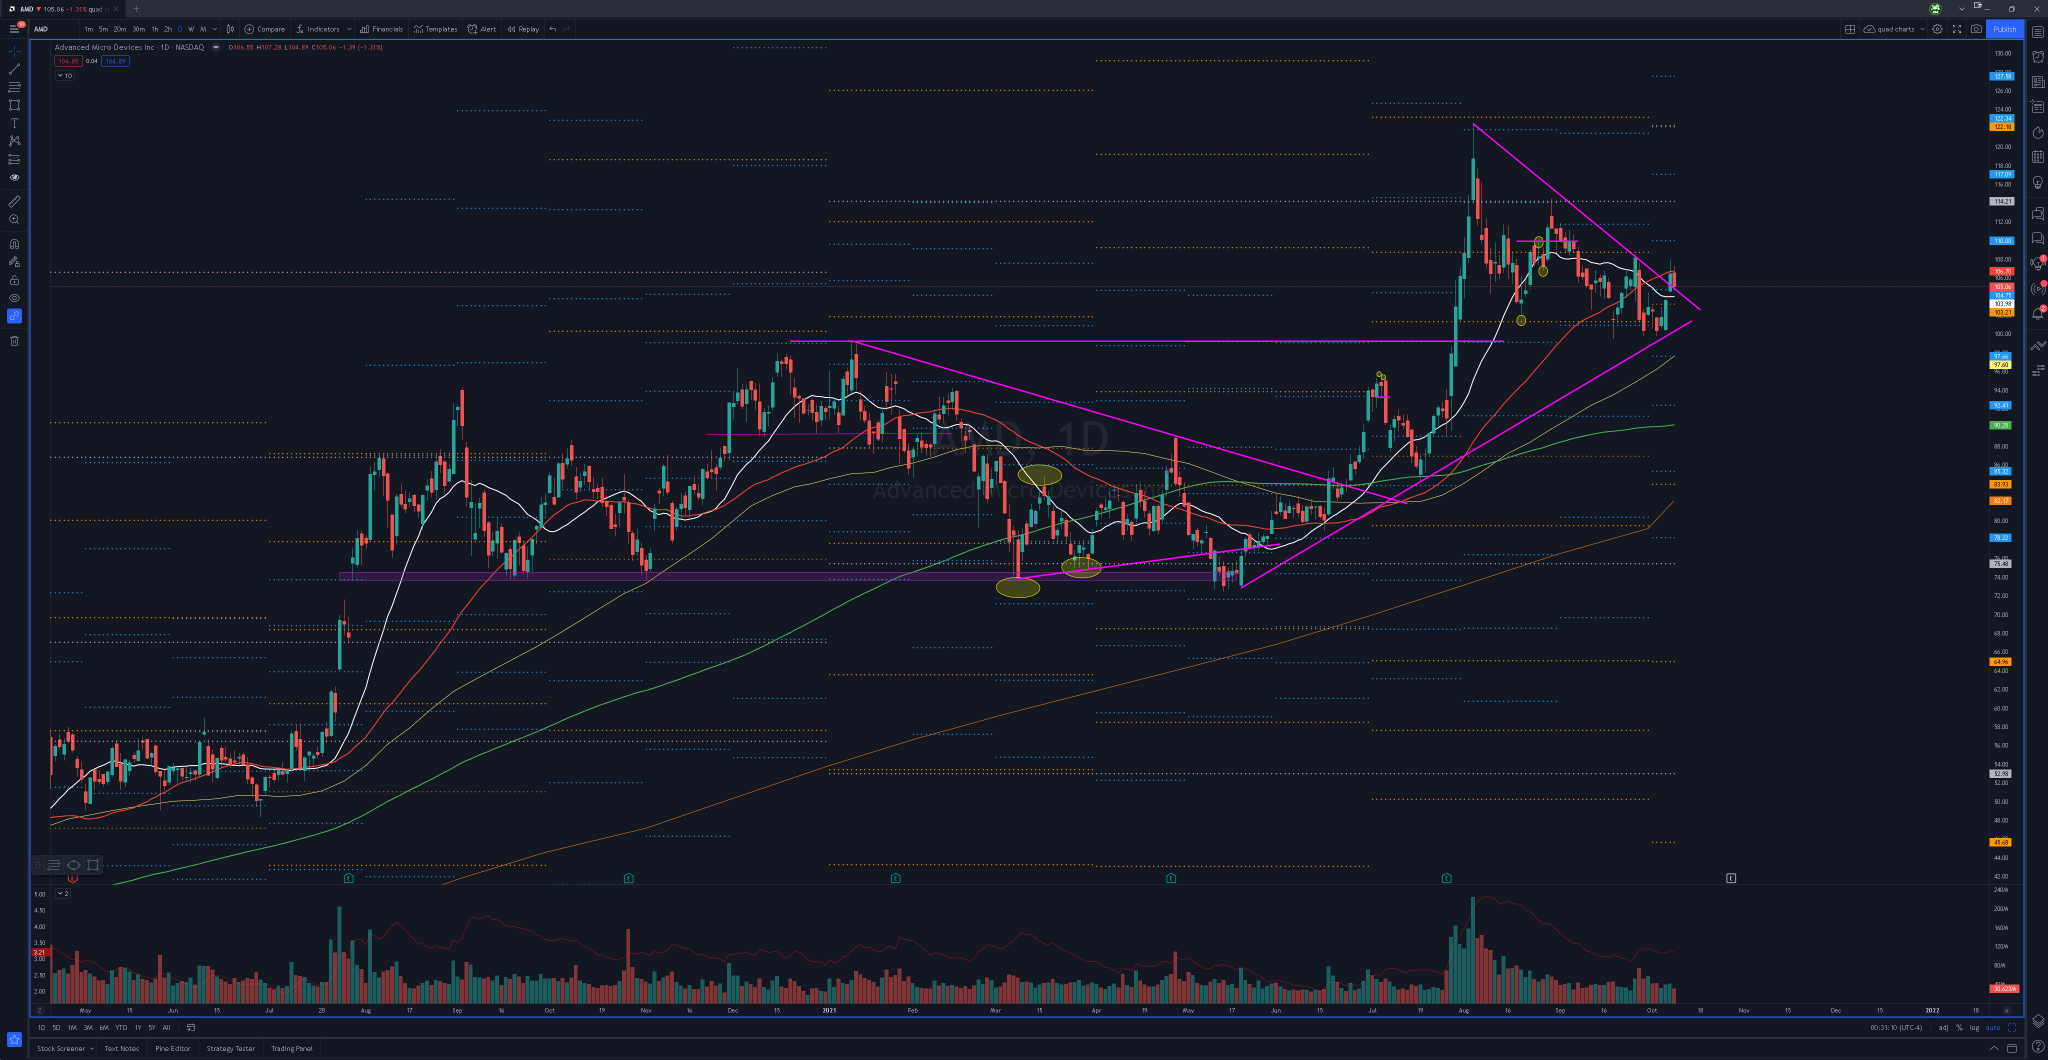
https://www.tradingview.com/x/AY0F5wju/
I like where this pullback from the highs has shown the ability to hold. It’s just a nice retest of the breakout from the 9 month long base that was built from Dec.’20-Aug’21 as well as the psychological 100 level. Will look for an early wash off the open to snag some in the 103 area where we have the quarterly pivot plus a retest of last Tuesday’s highs.
$UPST
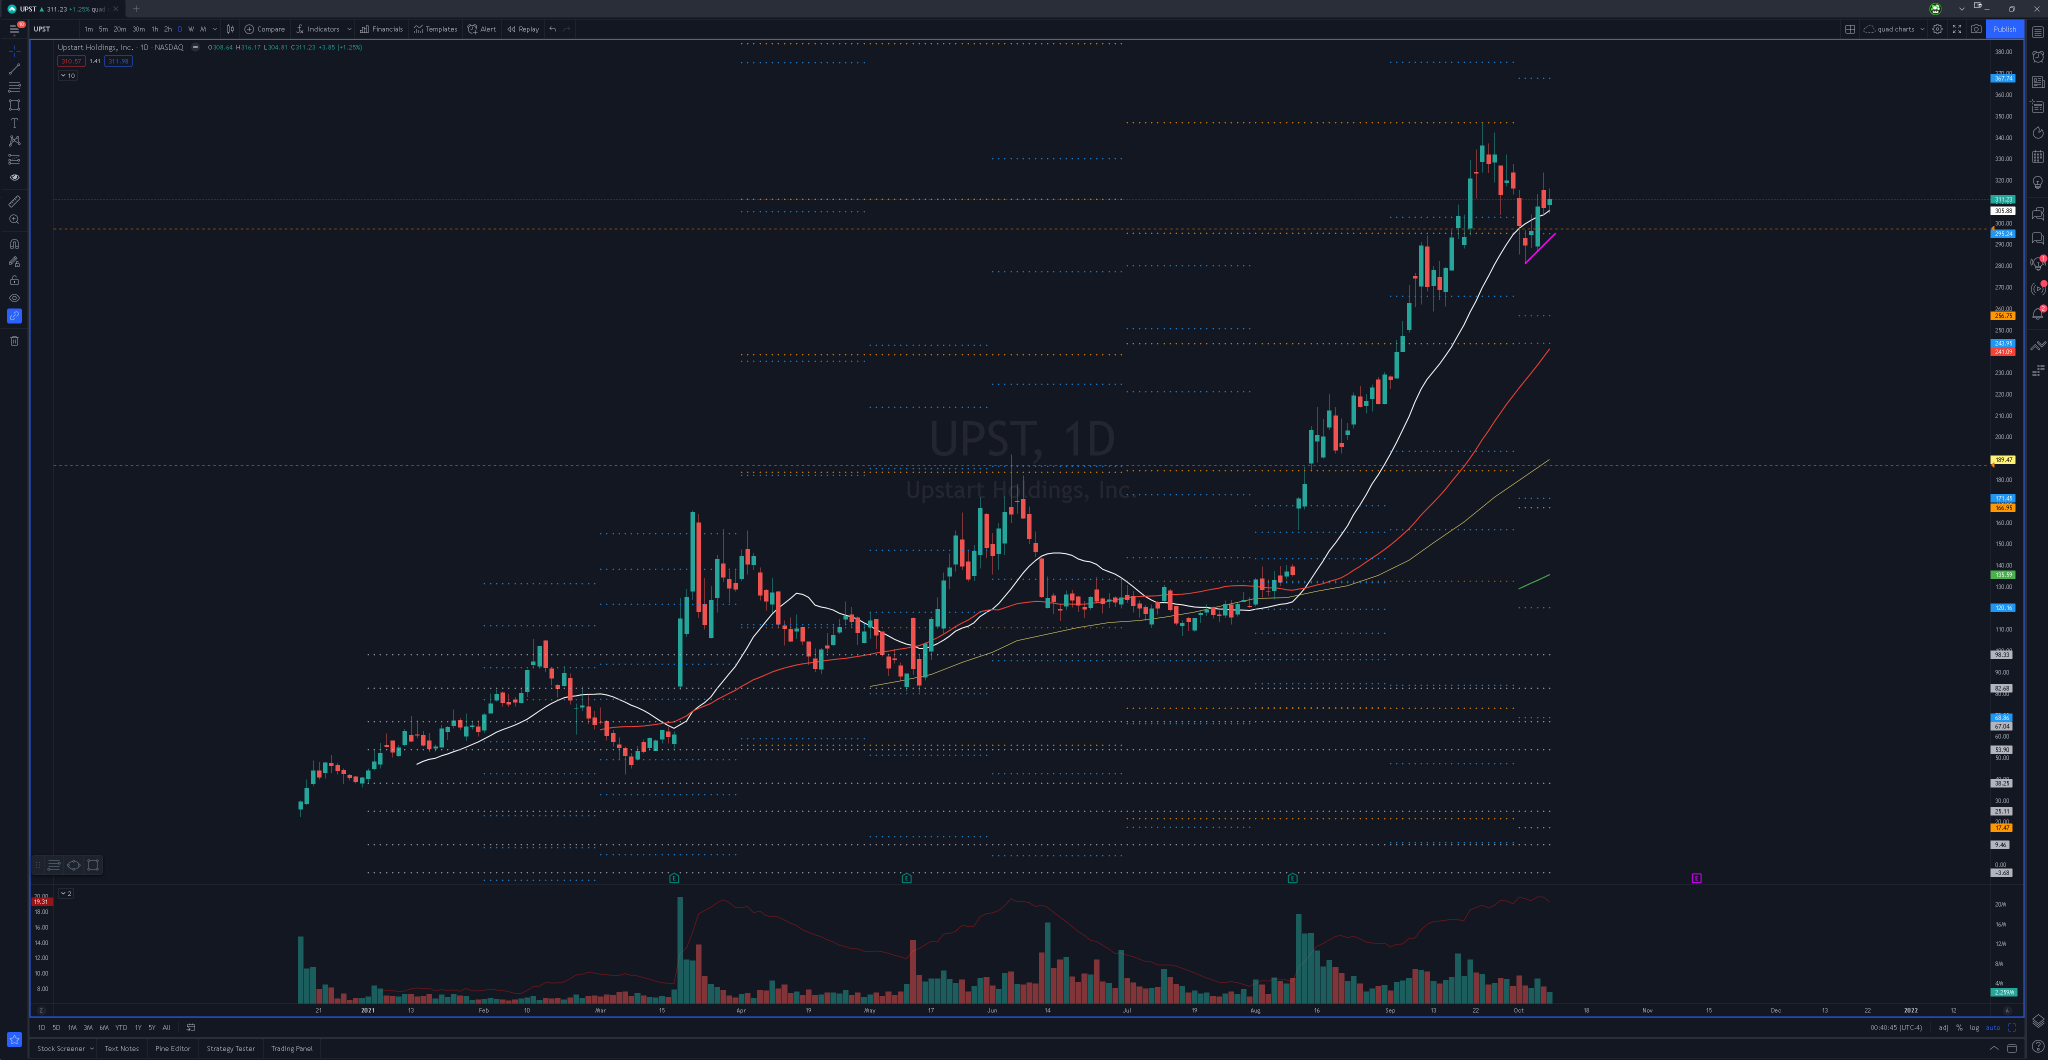
https://www.tradingview.com/x/ZfZp4Fhx/
Name has been strong ever since it’s earnings breakout. Recent pullback to the 20d has found some support. Just looking for a flush down to 295 to find some buyers. Almost 20pts of ATR on this name, so position sizing on something like this is EVERYTHING.
OVERSOLD STOCKS – REVERSALS
$PAGS
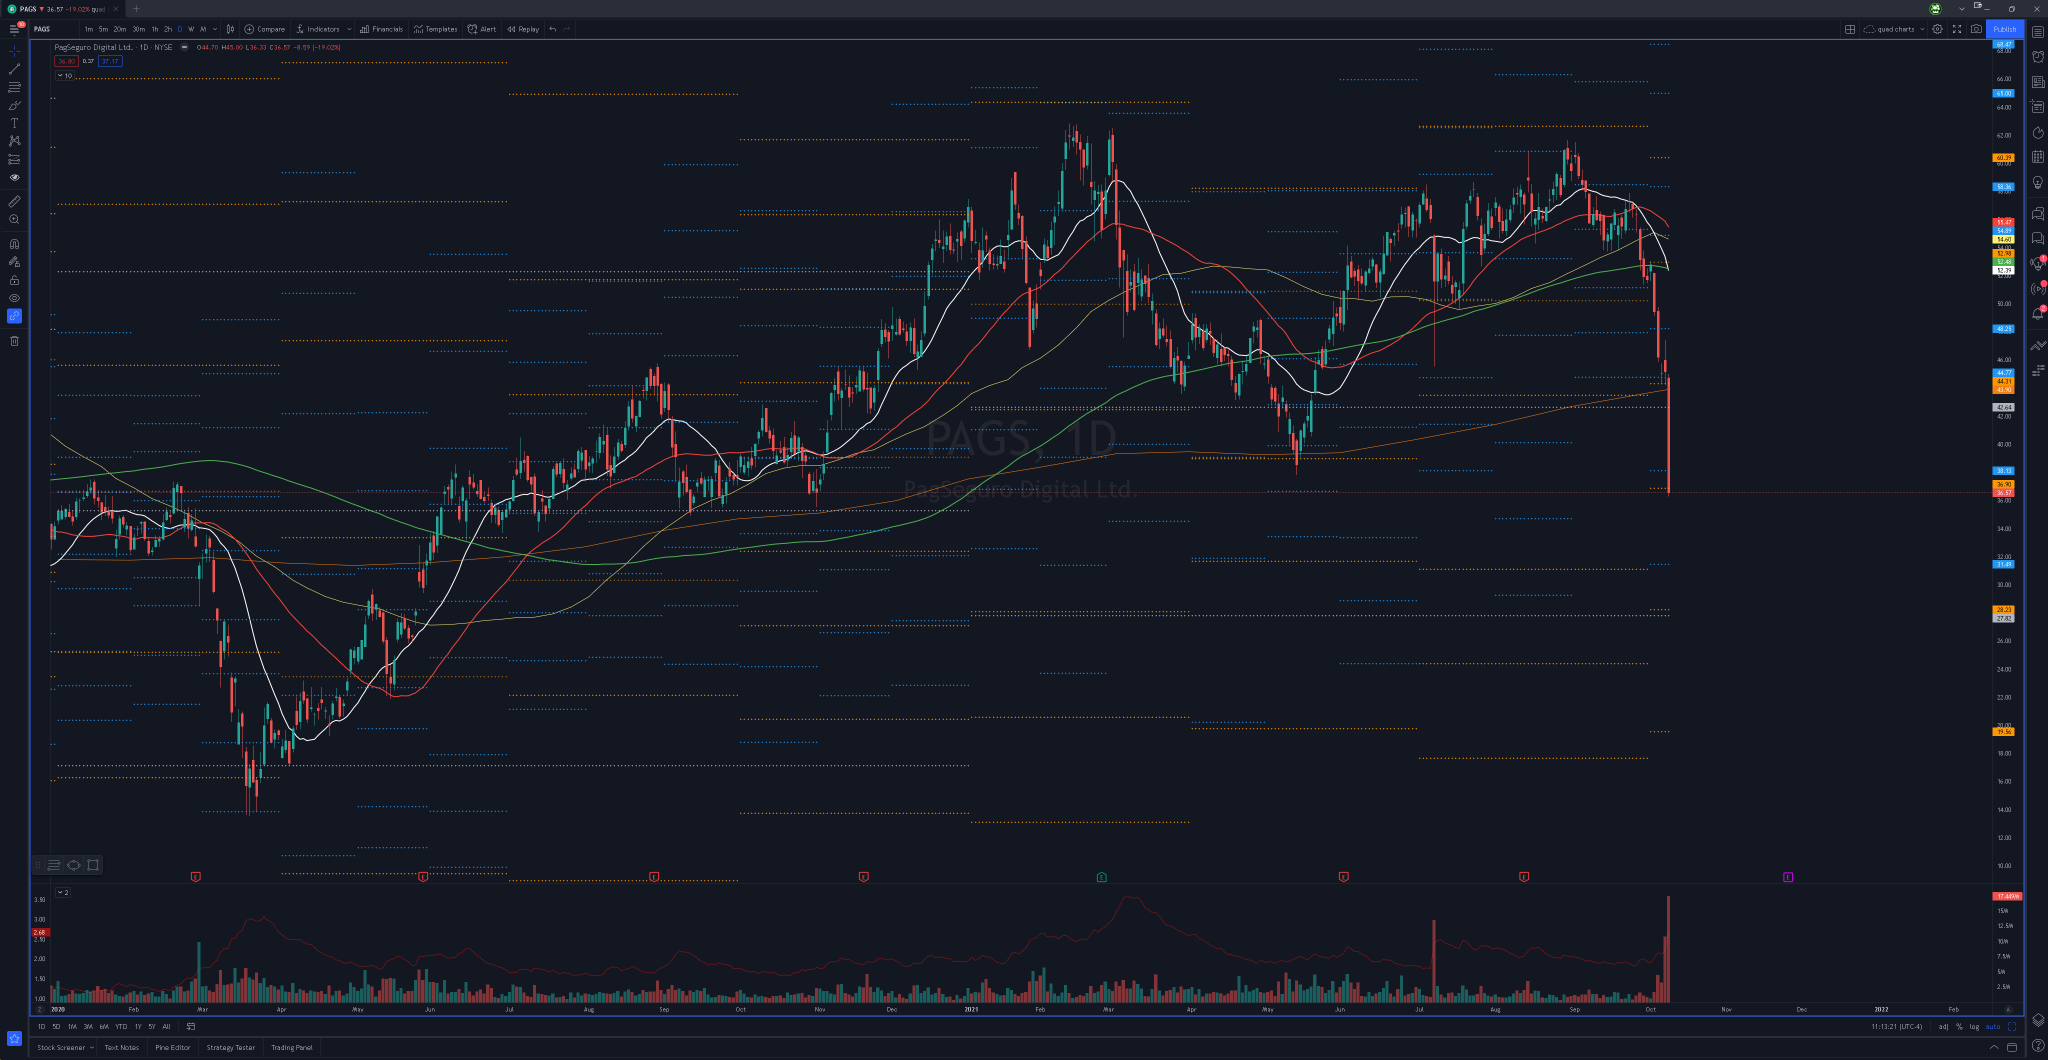
https://www.tradingview.com/x/MOjZK88I/
This is the extreme kind of move I really like. I believe they released earnings early and this is kind of a reaction to that and some of the stuff that is going on with Brazil’s interest rates as well. I still think there is a huge opportunity on this. I don’t know if we would flush to 30 on this or not. Will be watching for any sort of emotional drop that can produce that knee jerk reaction where it looks like the sellers have exhausted out and the longs have stepped back in. That way we can look to buy with set risk. I don’t think it would be surprising at all to see this give a 5-6pt bounce if it can exhaust to the downside. I know it’s a $2 ATR, but it had a 9pt day on friday.
$TMUS
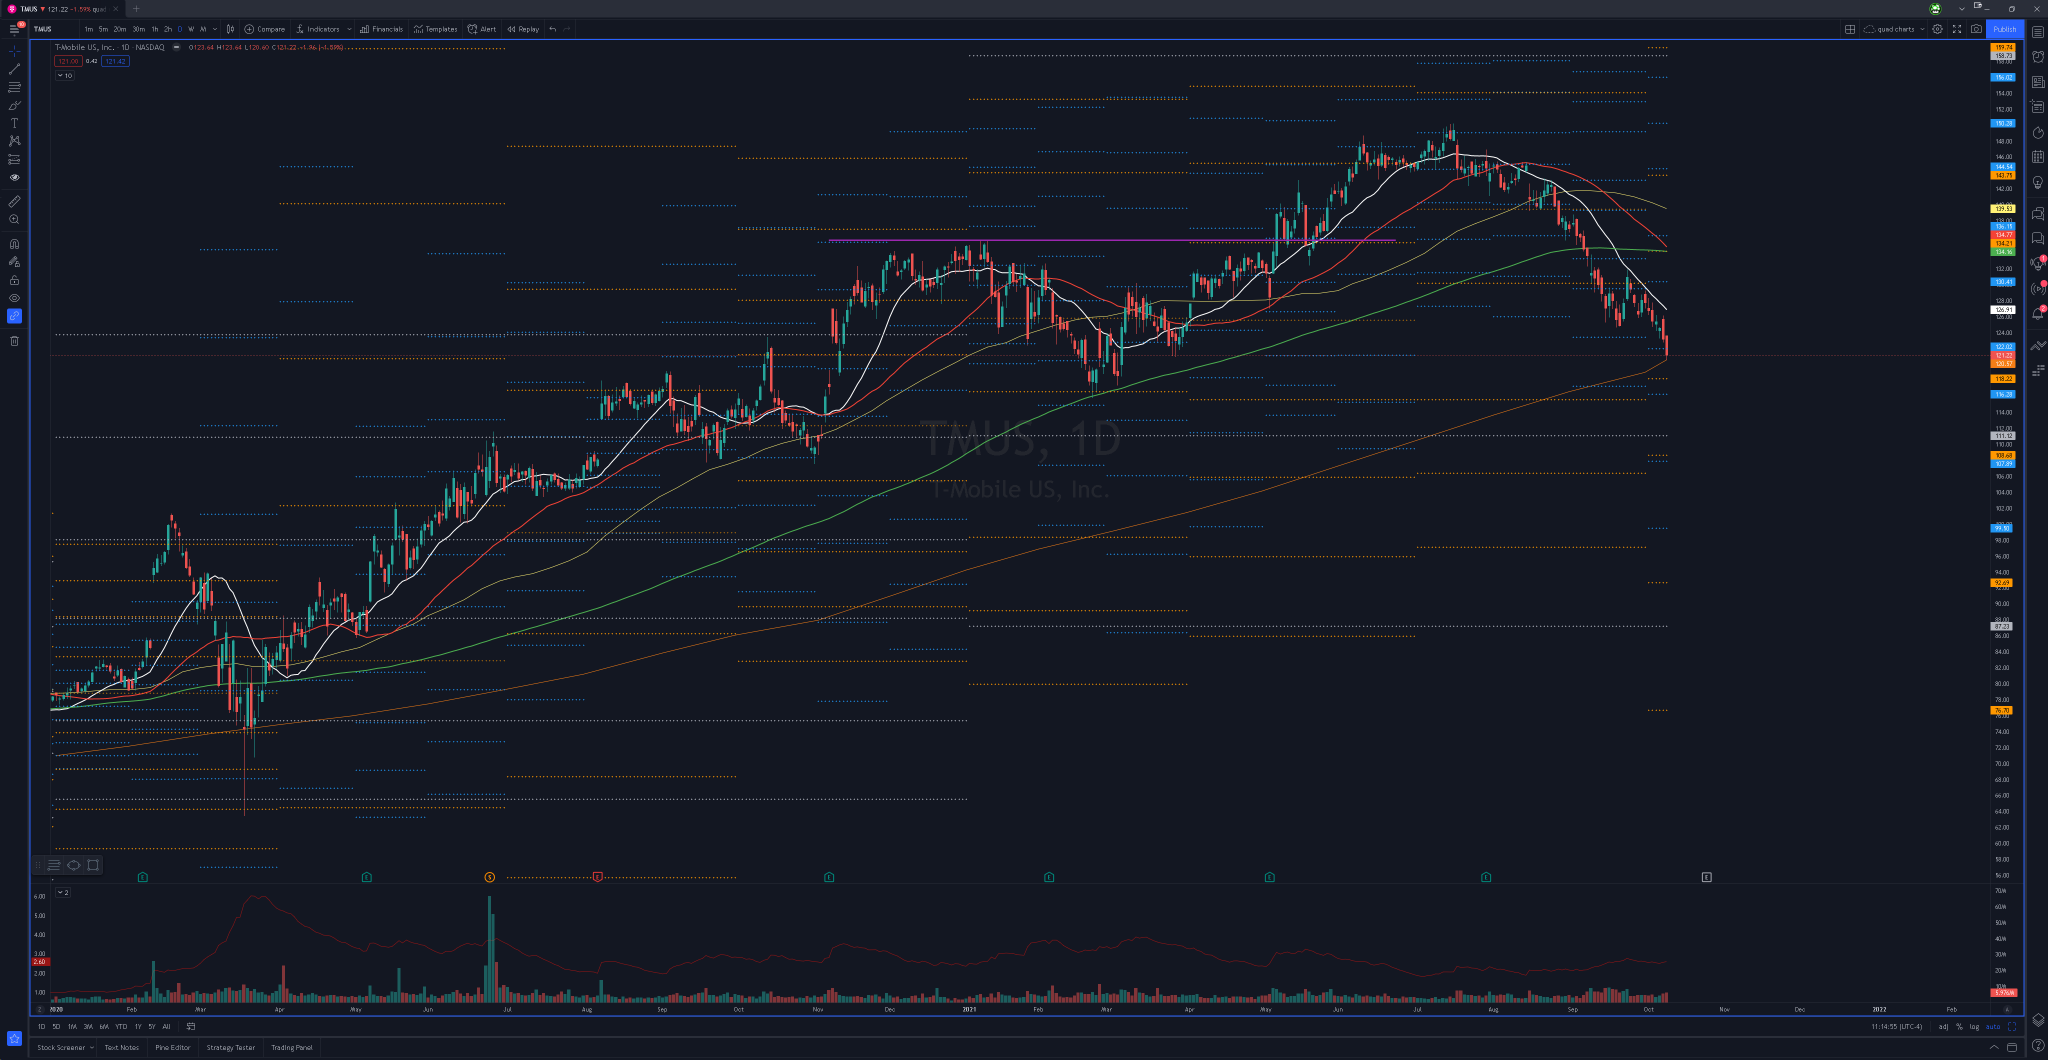
https://www.tradingview.com/x/a0UV8fZ3/
Now I realize that the difference between this idea and the PAGS idea is night and day. But I still like the extension down away from the 20d as well as the fact that this move down has pushed us right into the monthly 20sma. We also have the February lows looming just below that as well. I really wouldn’t be surprised to see this get a bounce back up into the 125 area. I would like to either get a flat-ish open or a slight gap up Monday morning so that I can buy a flush with risk under Friday’s lows. If we gap down then I would be looking to scoop an emotional flush down into that 115-116 area where you have February’s lows and the monthly pivot.
SHORT SETUPS
WEAK STOCKS – CONTINUATION
$TGT
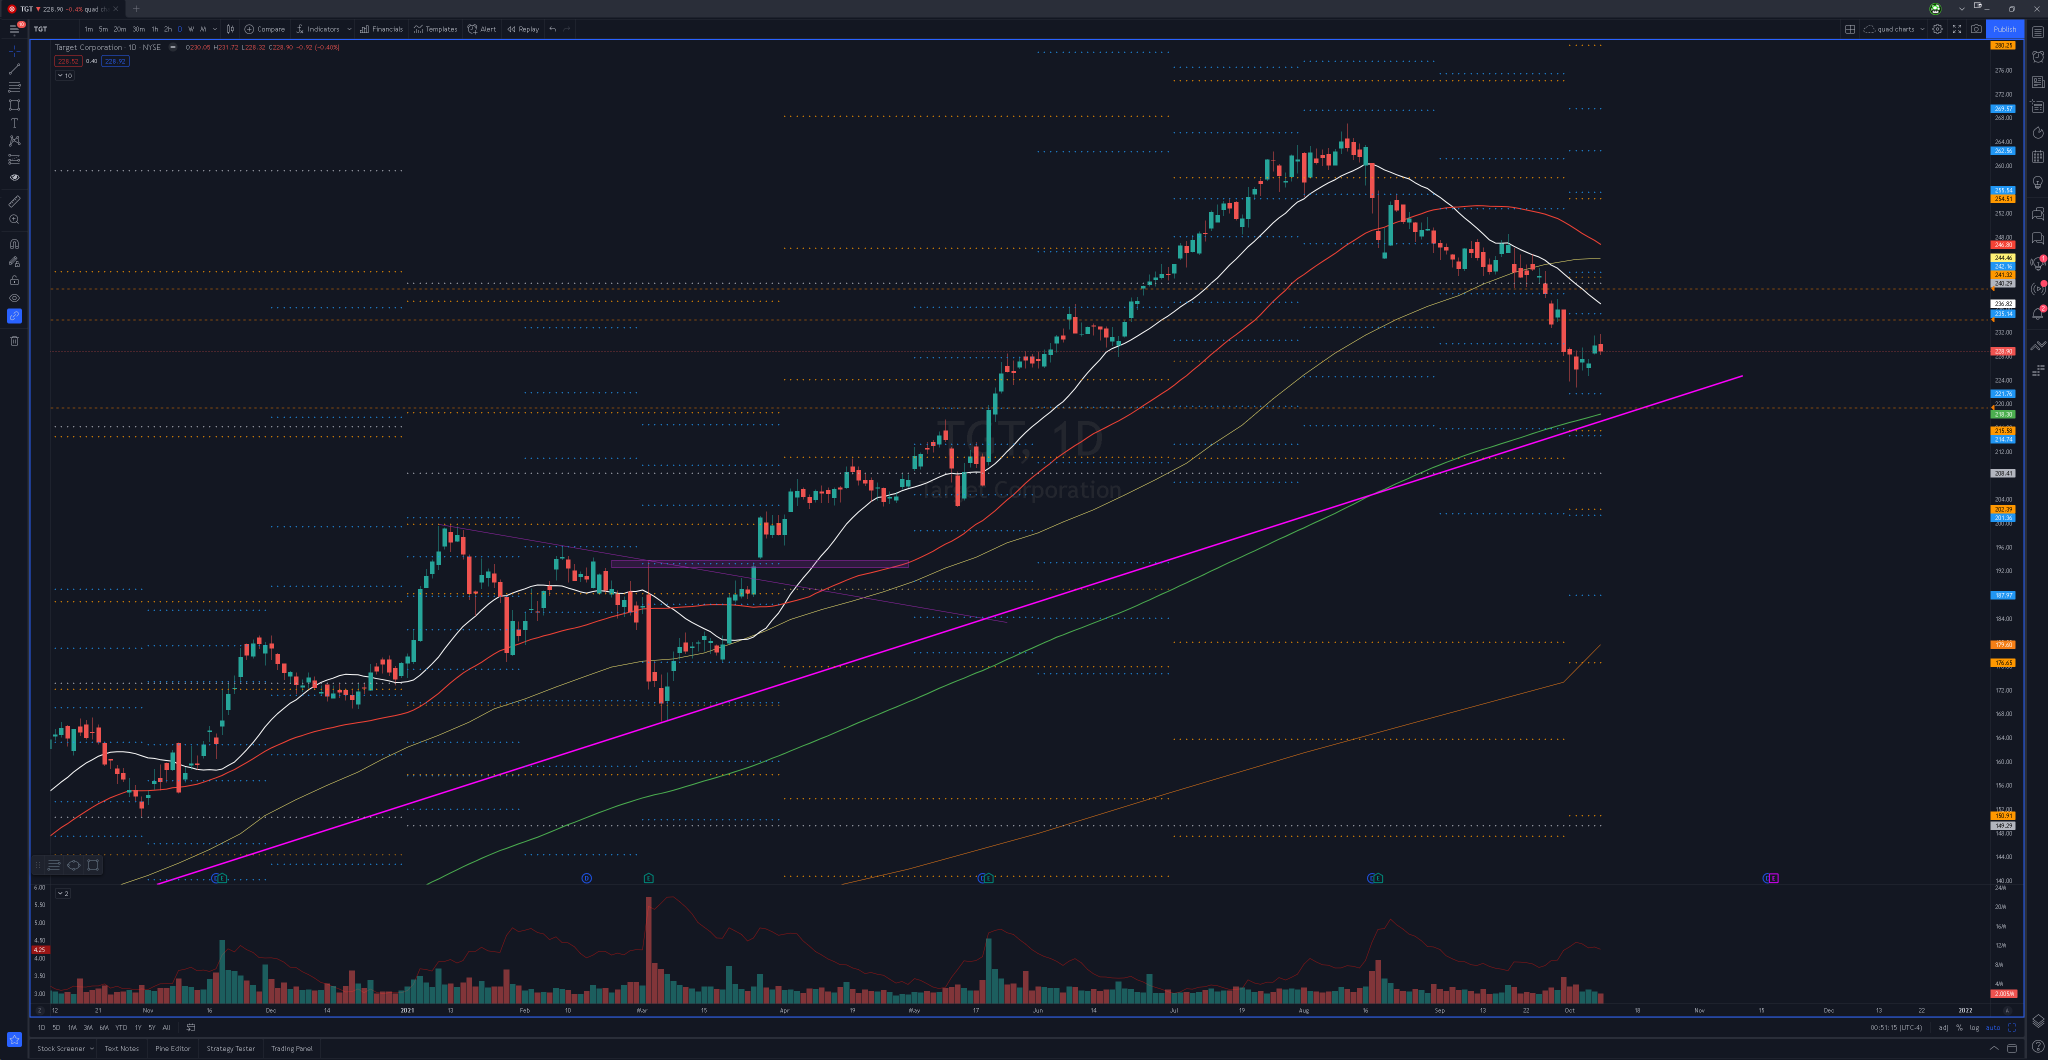
https://www.tradingview.com/x/FbQC2abd/
This one was on our Sunday Prep quite a few times. If you look at the retail ETF $XRT, the consolidation doesn’t look like it can be easily broken anytime soon. Any kind of push back into 93 – 95 you have all this resistance on the ETF. This can really translate into some levels on the names finding resistance in the sector. I like the 235-236 area, but if that area can’t hold the price down, I have zero problem taking the loss on it and reassessing if it can push up into that stacked pivot area around 241.
$MU
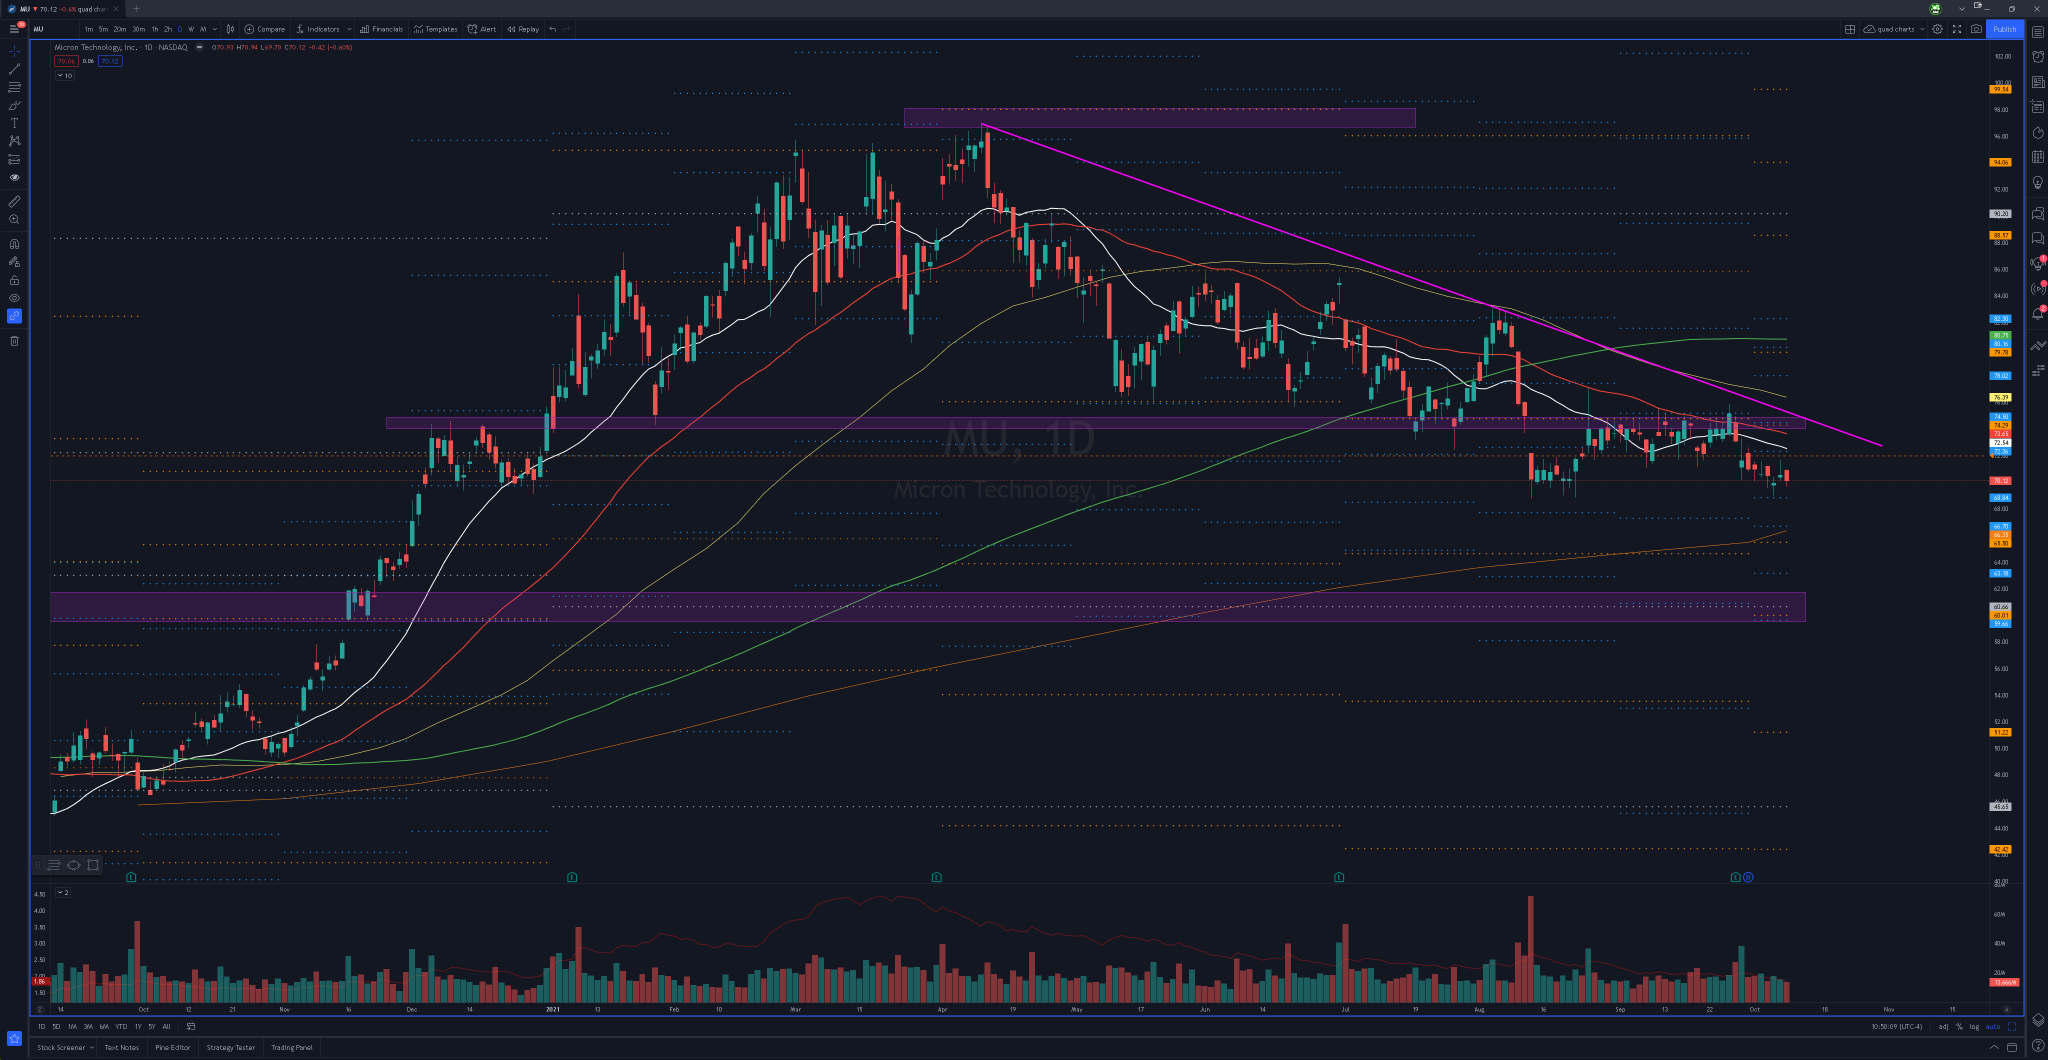
https://www.tradingview.com/x/JDHwr9vy/
Has been trending down the 20d/50d. Looking for a pop back into the underside of the 20d around 72 to get short. If that doesn’t hold I may look to revisit the name around the 74 – 75 area where you have the 50d. 75 is a huge psychological level and it coincides with the downward trendline that it has been holding on the daily. On the other hand, if we lose last week’s lows, this could easily see a 65 test where you have the monthly 20sma. So if we start to rollover under last week’s lows, I may look to join the trend, shorting pops on lower highs with set risk.
$KSS
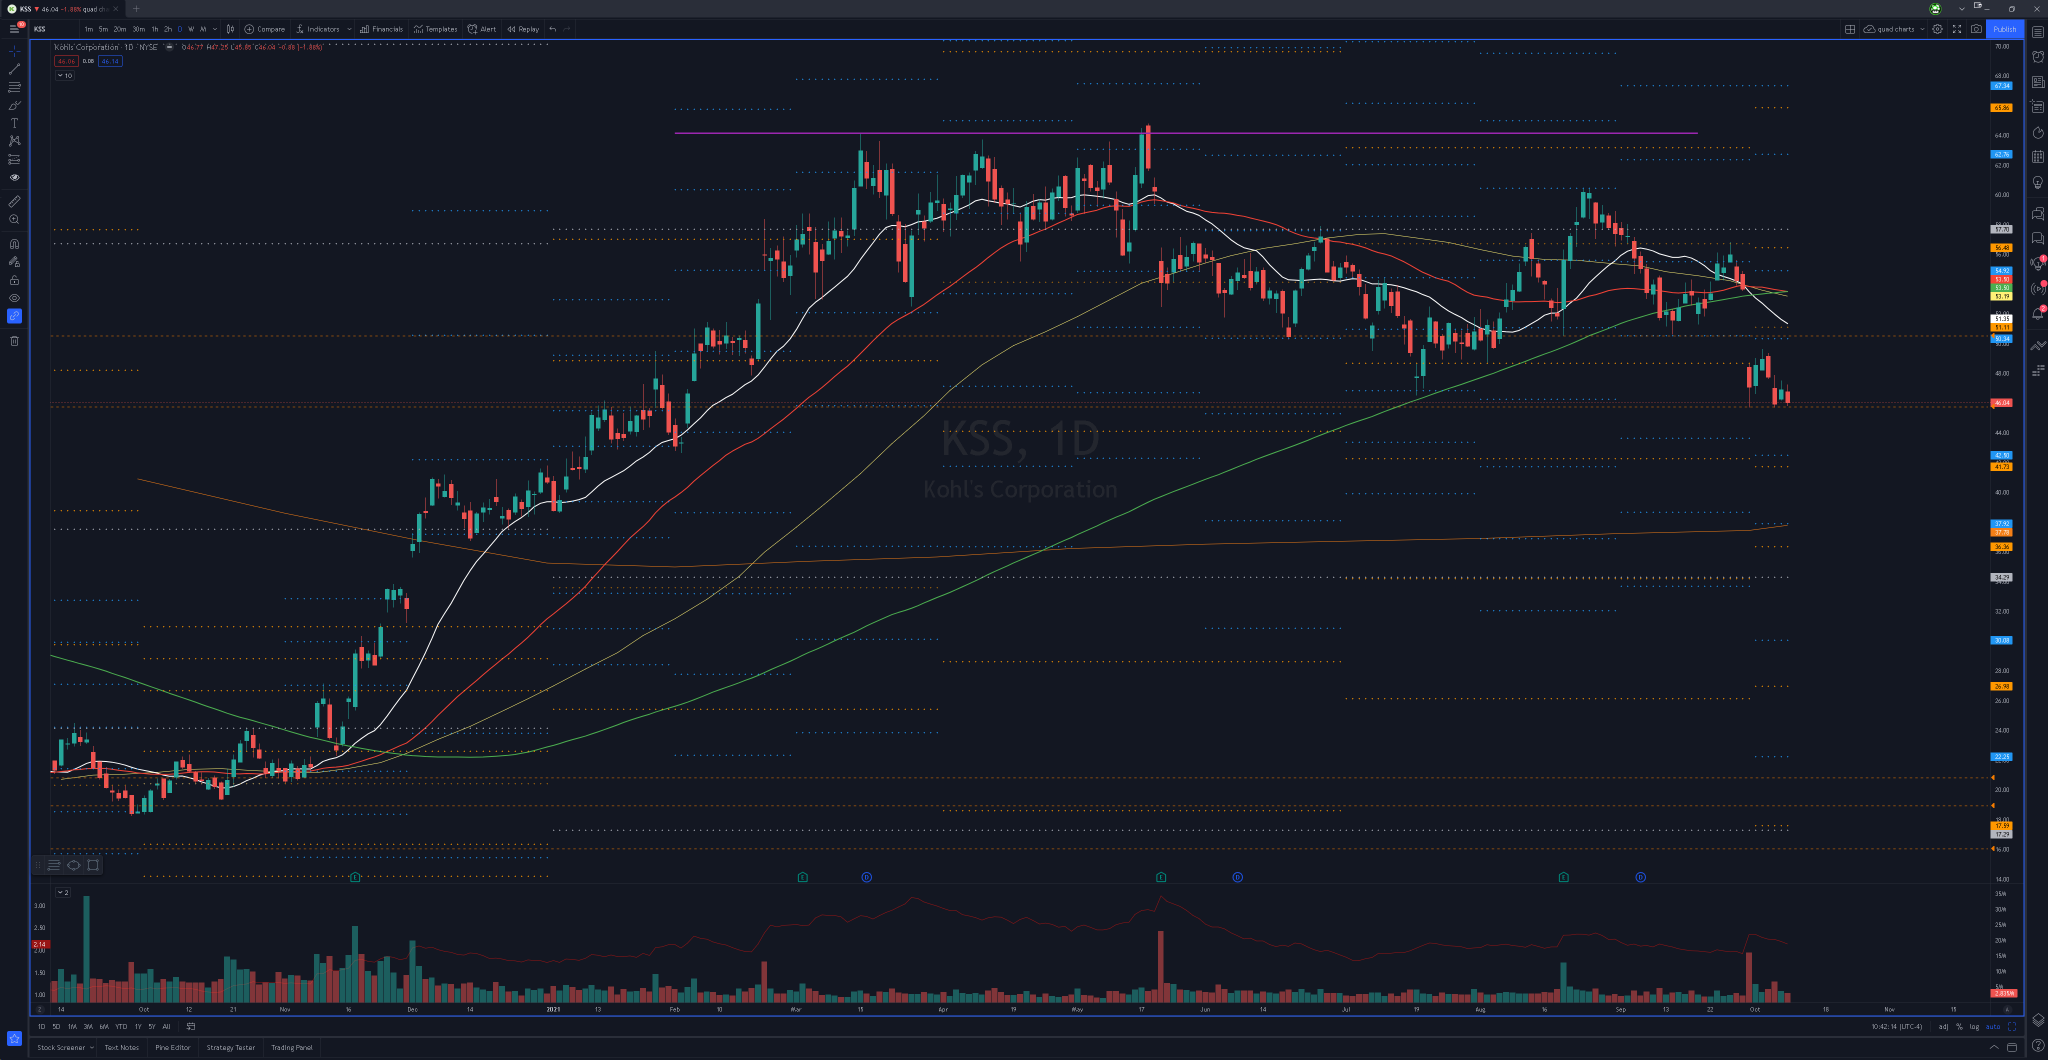
https://www.tradingview.com/x/qVAY0zH7/
You can see it flirting around with a big breakdown level. Under last week’s lows and I will be looking to join the trend, shorting pops. If we push back into the underside of the 20d/50 psychological level, I will look to short as well but would want the move up into those levels to be emotional and have some speed to it.
$ARKK
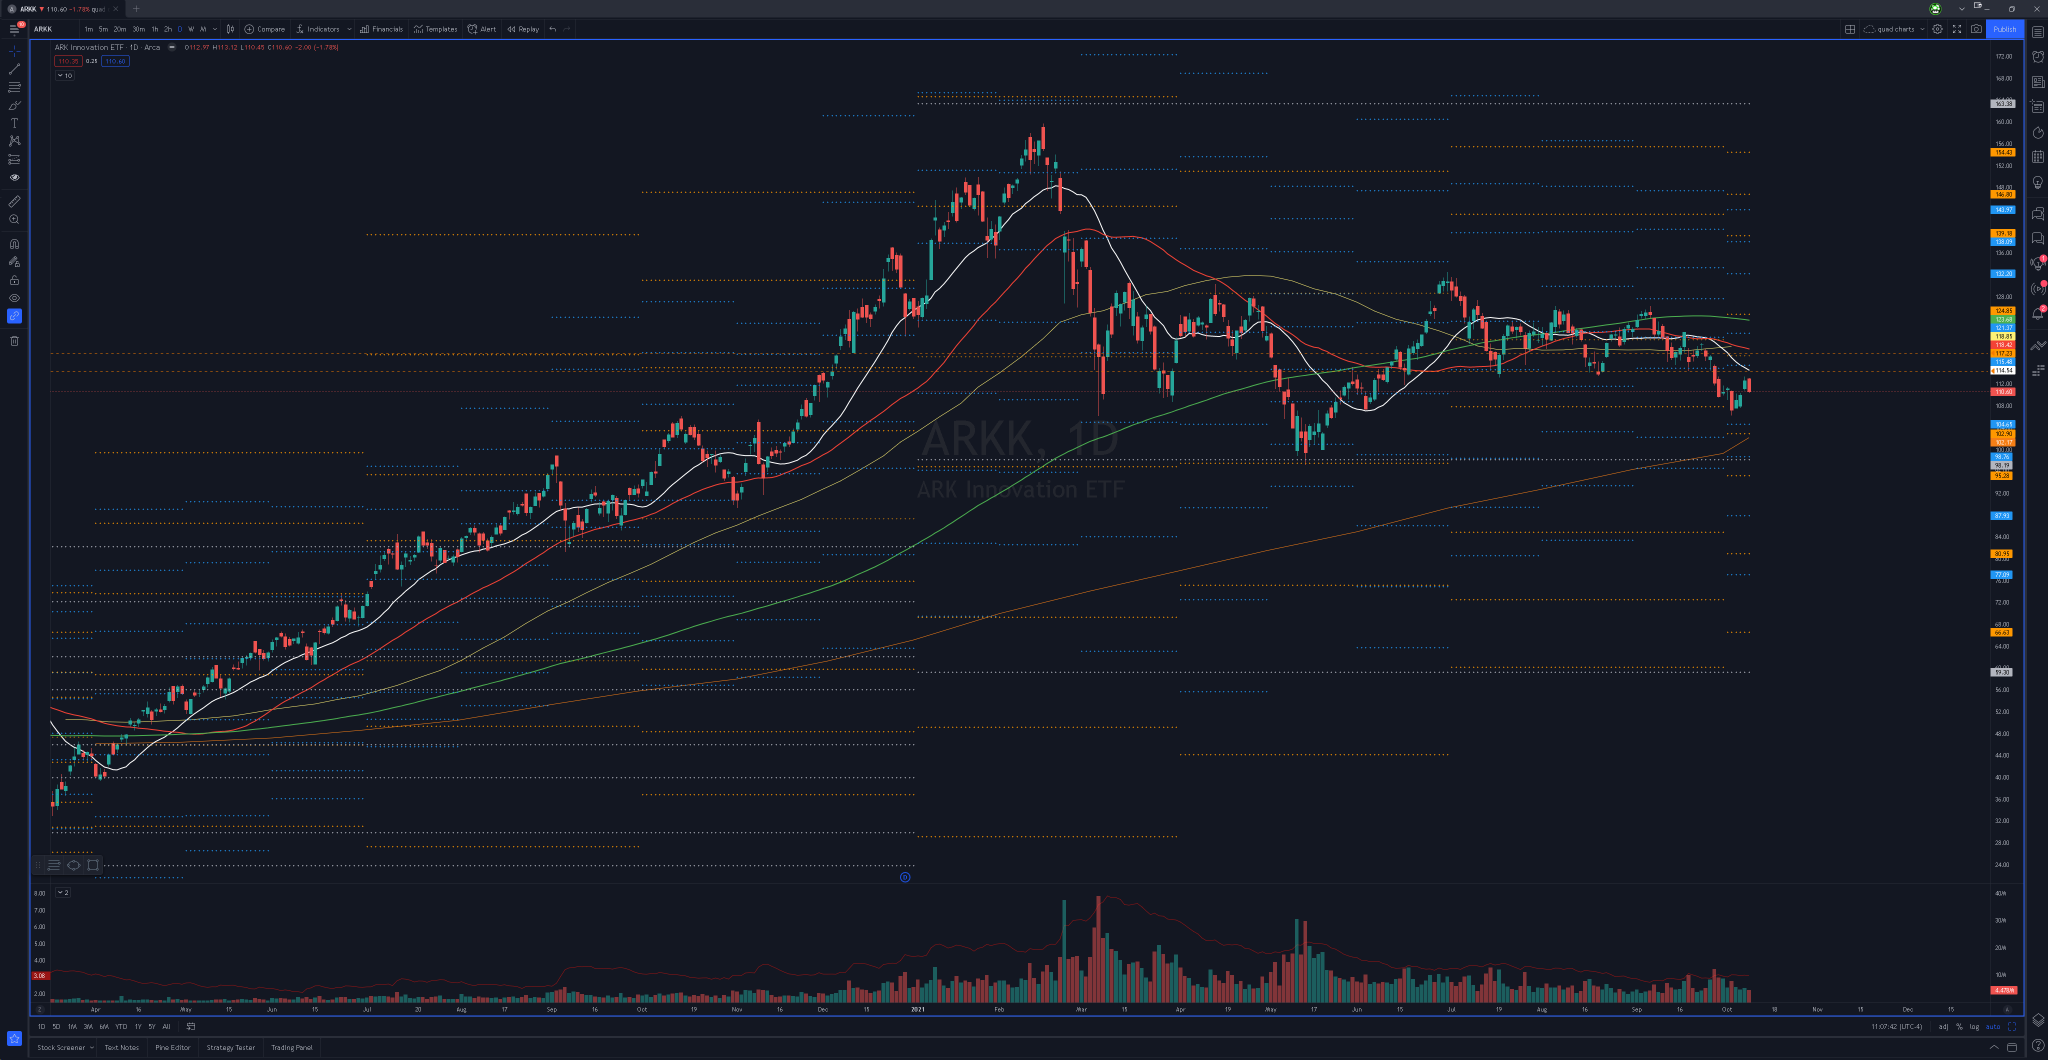
https://www.tradingview.com/x/IUCKB3m6/
There’s a lot of names that ARKK owns that gets spanked. Look at $PLTR, even though it had a great chart, it rolled over. These names that they own always find a lot of sellers. The idea is to short a pop into the underside of the 20d. If it doesn’t work there I will revisit at the 50d/monthly pivot.
OVERBOUGHT REVERSALS
$COP

https://www.tradingview.com/x/YnMifFxv/
Remember $XLE, if it pushes up into 62 I really think we will find some resistance. Personally I will look to trade the stocks underlying this ETF. $COP is one of them. Will definitely be looking to short ConocoPhilips if we slam up into 80.
$PXD
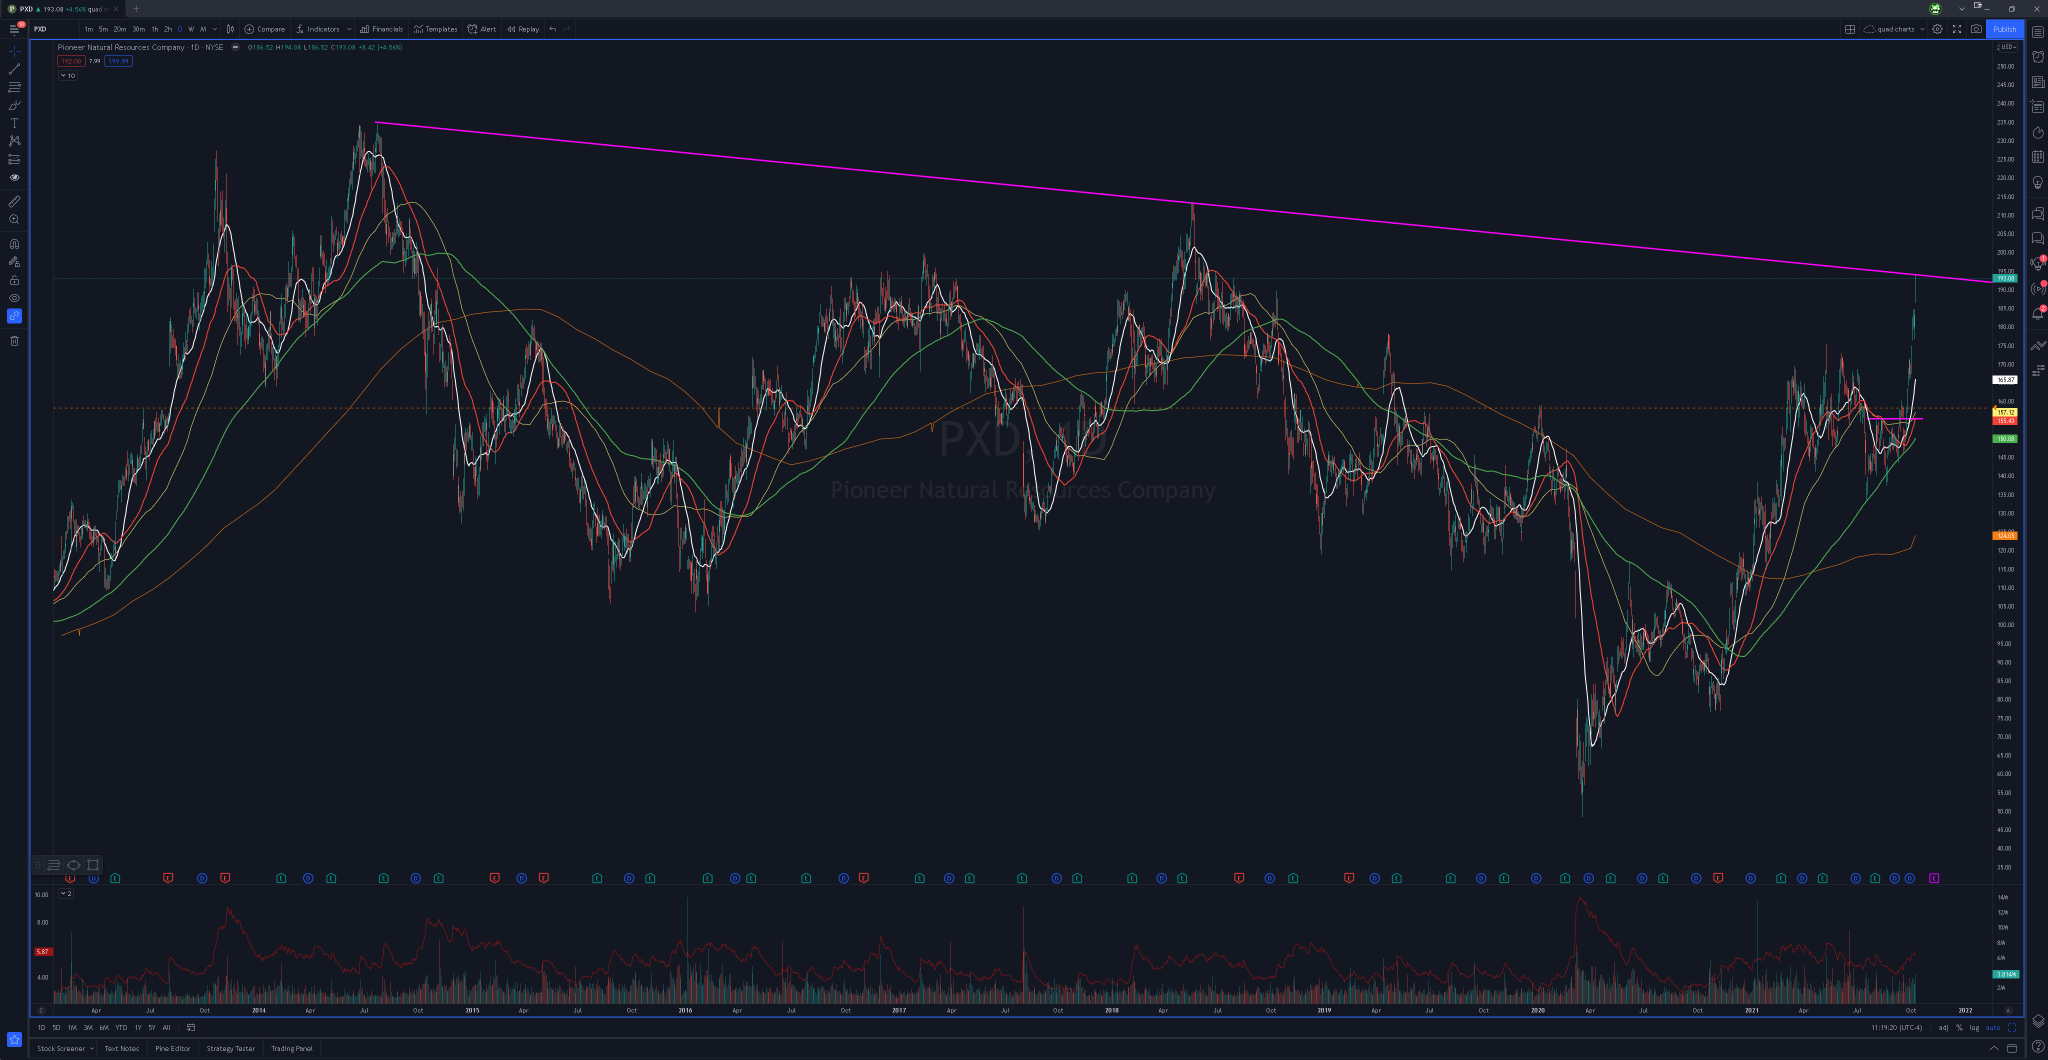
https://www.tradingview.com/x/cnyvtoUG/
This name is already extremely extended and if XLE does NOT get that extra push higher then there is a good chance that this name becomes the focus as it may be ready to have it’s pullback from here. That doesn’t mean that it’s not tradable if XLE does indeed get that 62 push, but the levels where this will be interesting if that is the case are much higher. If XLE pushes, then the levels I’m watching $PXD are going to be up around 213. Either way, I believe there is a big trade coming in these names.