Broader Market
$ES / $SPY
https://www.tradingview.com/x/emvarAvZ/
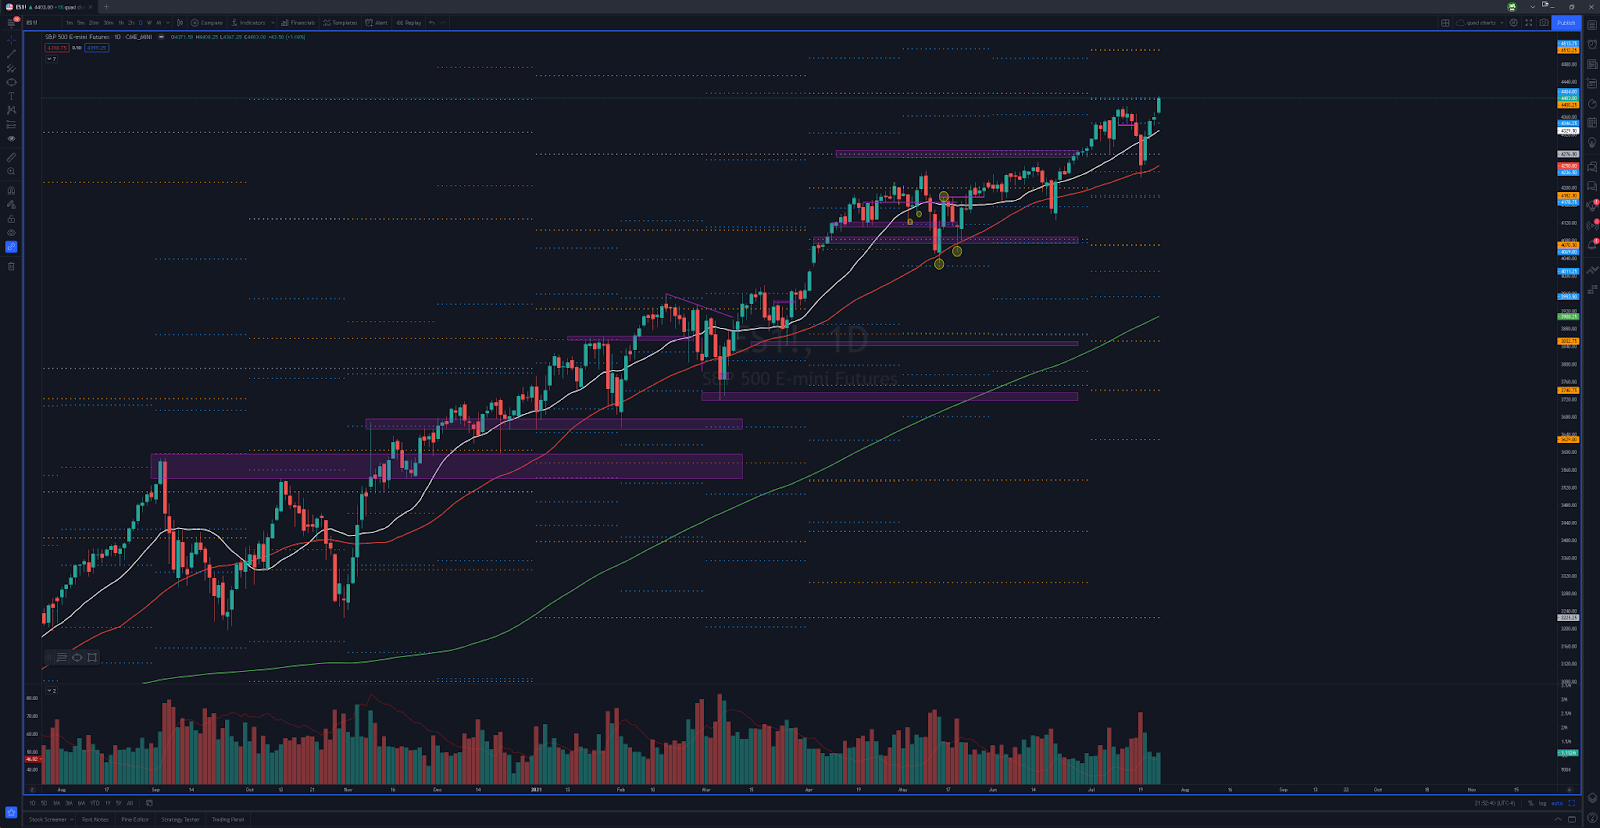
The market gave the retrace back to the 50d like we were thinking it could. But the problem for me is that it didn’t spend any real time down there. Instead, it immediately bounced and we are already back at new ATHs. It really gives me concern about whether it can actually hold. Only time will tell, but moving forward, I will be pretty cautious with longs. As always, the higher it goes without any consolidation, the more I will lean towards looking for short setups. Starting to wonder if 4500 is in the books for this week at some point. Butttttttt……
…..remember, this is arguably the biggest week of earnings season, so if certain names miss on numbers and get smoked, so too might the market.
https://www.tradingview.com/x/1lV0hAdH/
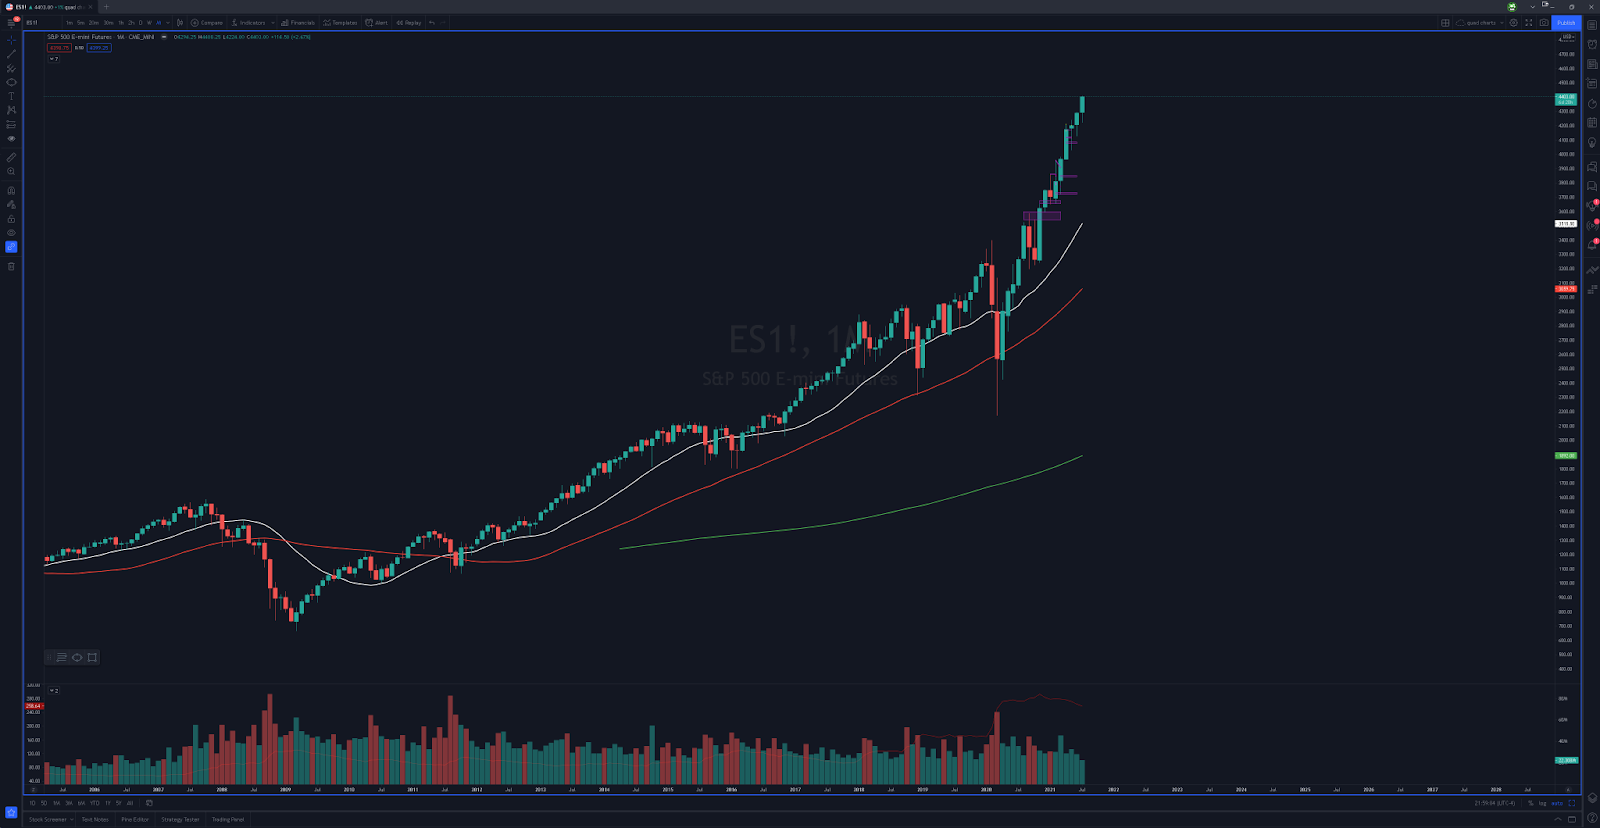
Interesting thing is that we haven’t lost the previous month’s lows since last September, almost a year ago. Obviously we will see signs of weakness well ahead of ever losing the previous month’s lows, but once we start to see signs of cracking, this would be something I look for to get confirmation that we may very well be starting to roll over. But please don’t misinterpret this as me being bearish. I’m merely doing the necessary prep work to always be ready for anything. Till then, laissez les bons temps rouler. To the moon!!!
$NQ / $QQQ
https://www.tradingview.com/x/jtWywH2Q/
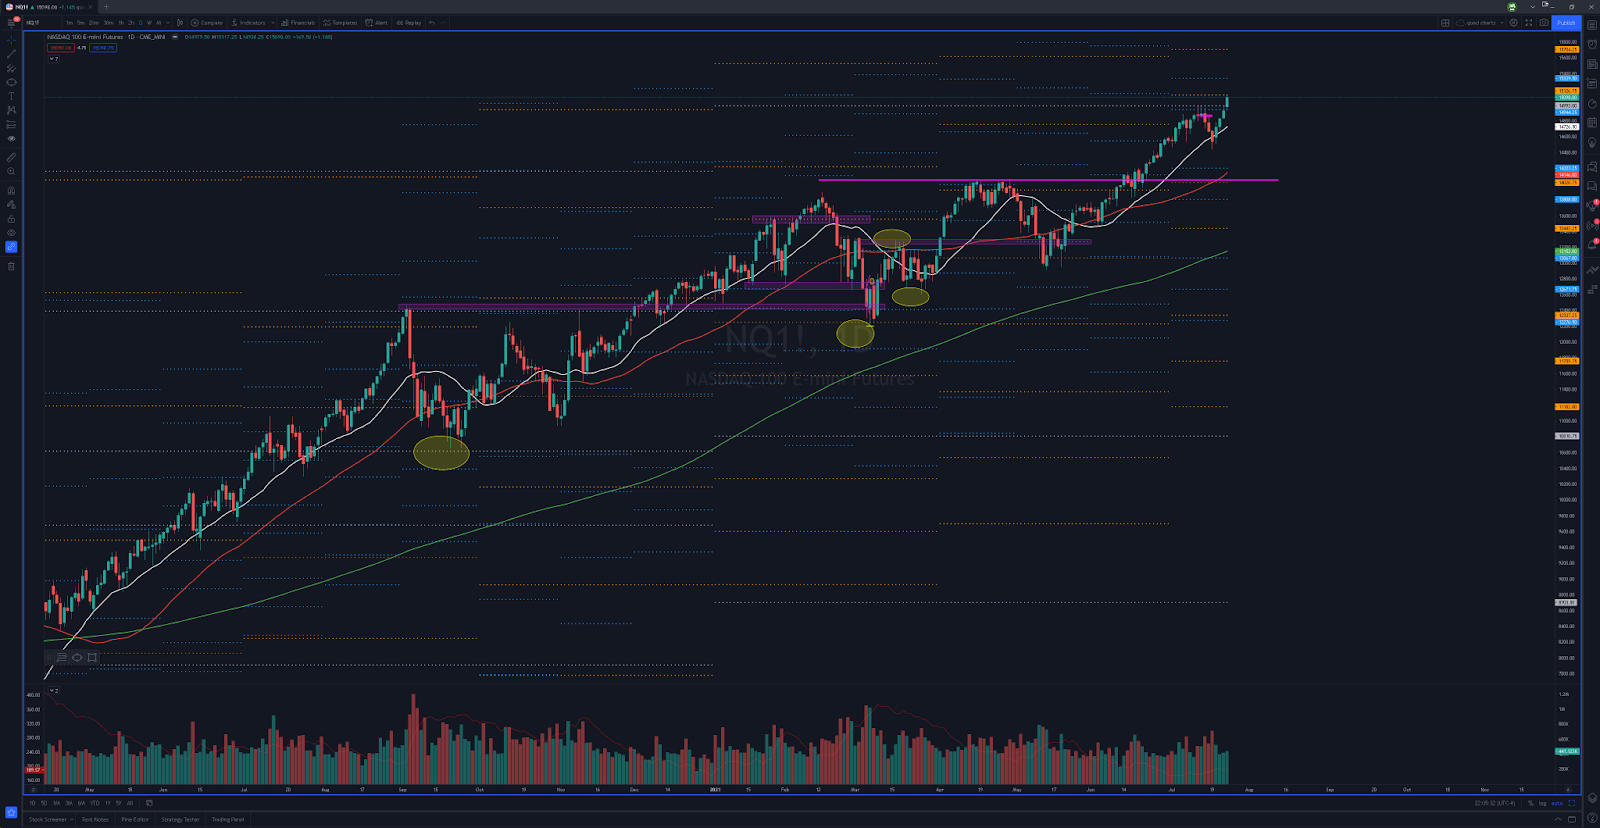
So like the S&P, the Nasdaq pulled back as well. But unlike the S&P, the Nasdaq’s pullback was shallow. It just made it back to the 20d, and I really wanted to see it closer to the 50d. So again, I think that the higher we go without a pullback to deeper areas, the more likely I am to look for short setups. Keep in mind, if at any time this week we DO pullback to much better areas and start to find support (for NQ or the ES), then I will be willing to look for some nice long setups as well.
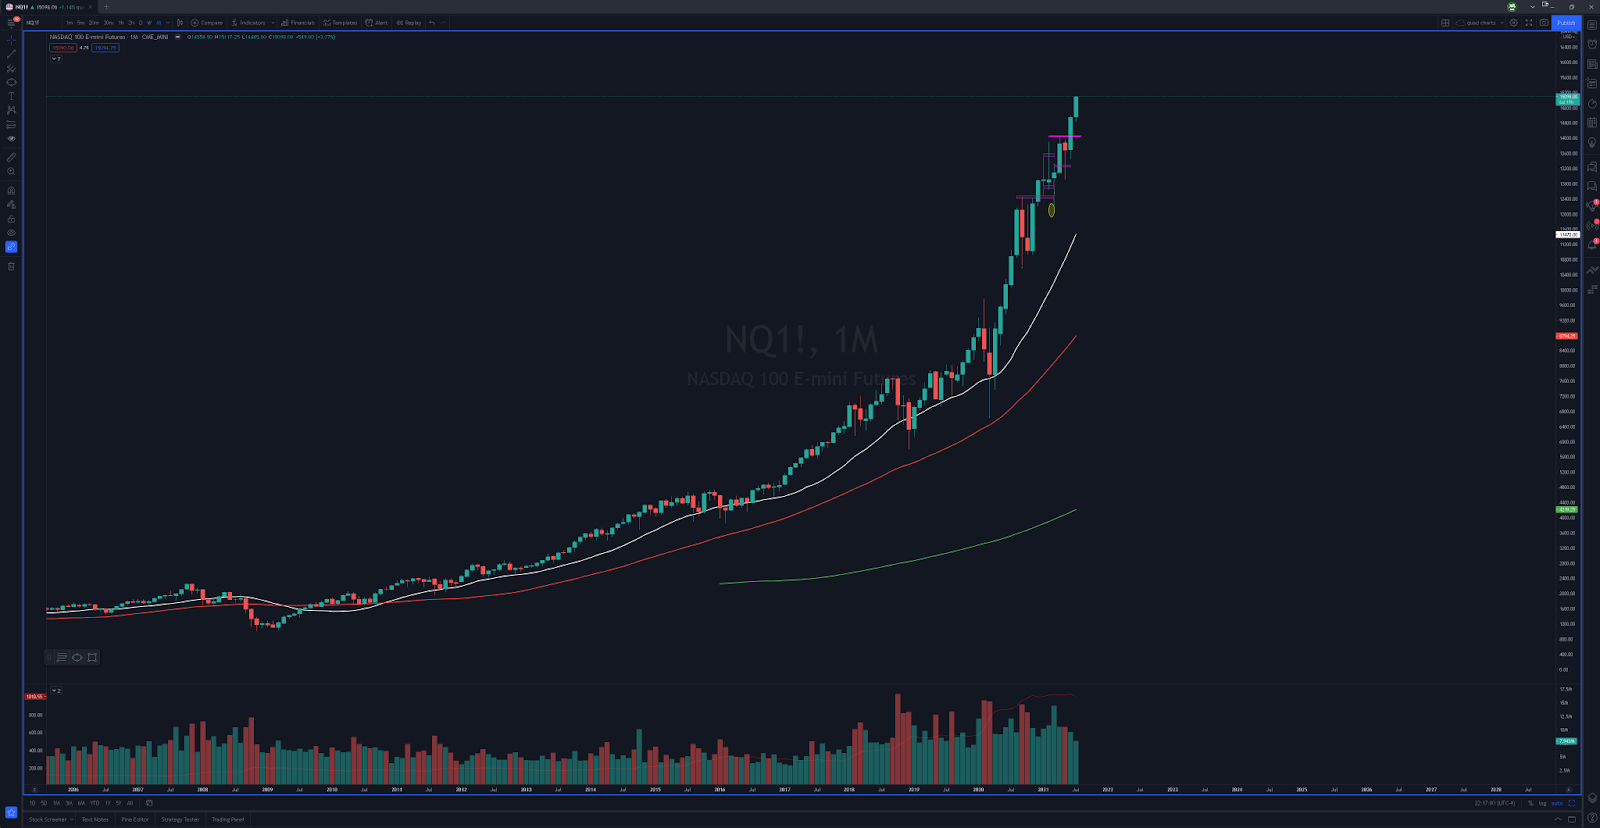
https://www.tradingview.com/x/Uwd1IWYX/
Notice, the Nasdaq HAS had plenty of months that lost the previous month’s lows. So there have definitely been times where the Nasdaq has had some decent resets.
$BTC
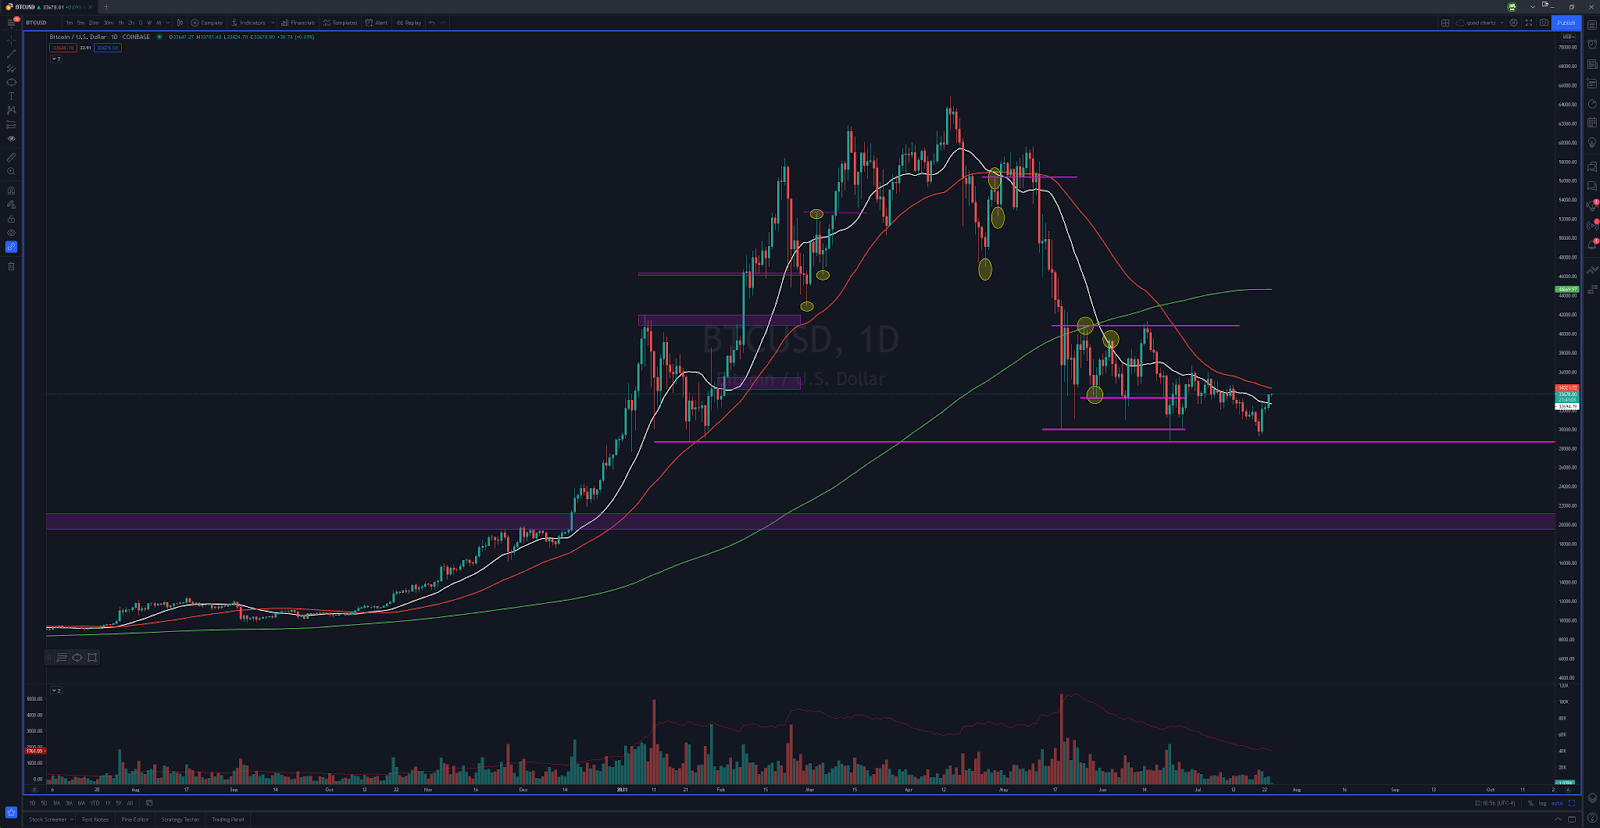
https://www.tradingview.com/x/v1zaVGBa/
Another week of sideways action, another week closer to creating the base needed for a healthy, substantial move higher or lower. You can see early last week we tested the lower end of the channel, and immediately found buyers down there. Interested to see how this eventually pans out. But so far, it’s digesting very nicely.
Industry Rankings
So doing something a bit different this week. Here are the major market sectors ranked by what performed best on Friday, and then juxtaposed against how they performed over the last 5-days, 1 month, and 3 months. You can see that a few sectors stand out as clear leaders; Information Technology, Health Care, and Consumer Discretionary. You can also see that Energy is still performing very poorly.
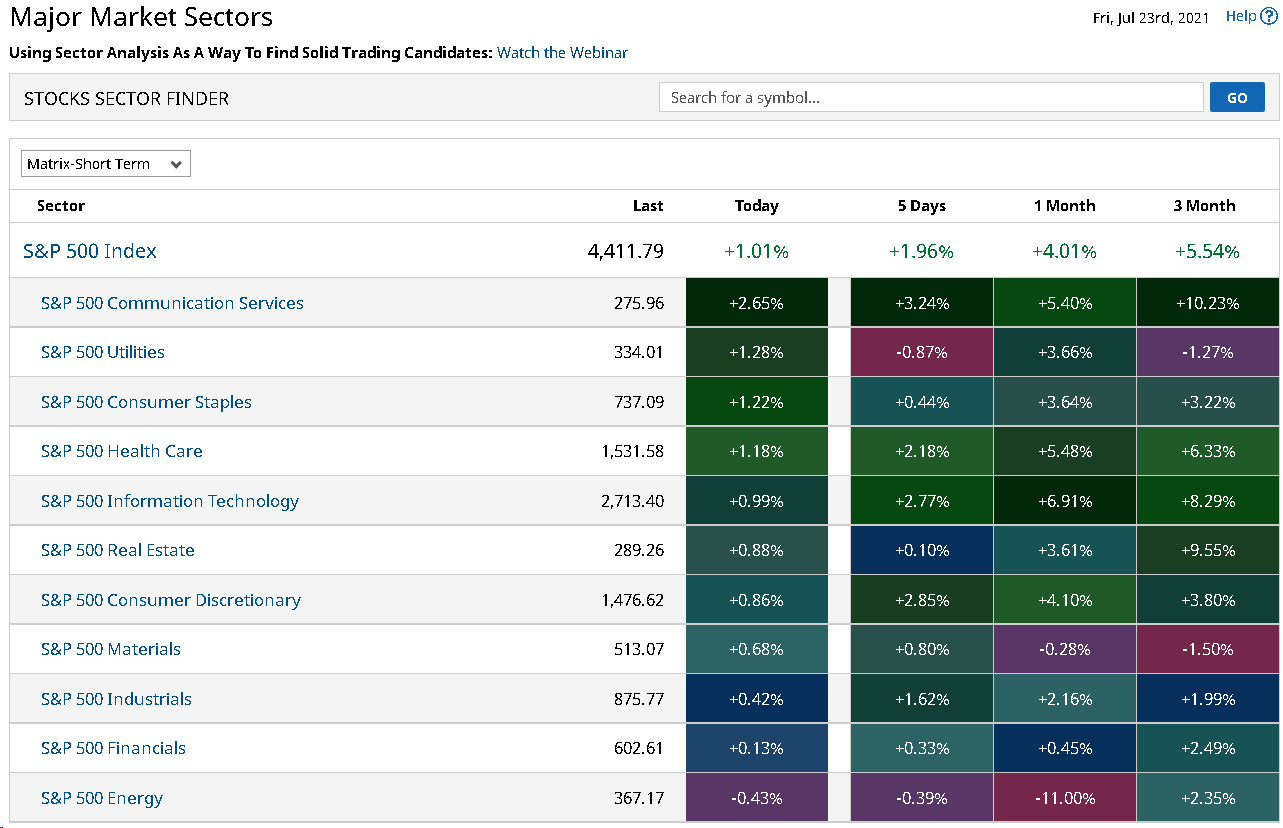
So once you single out the sectors that have the strength/weakness, you can drill into them and look at individual stocks in the sectors and see which ones are the leaders of those sectors. Keep in mind that the market just had a big rally and I’m personally thinking I may be looking to identify good short setups. That thinking leads to the insight that if something was weak in a strong market, how do you think it’s going to perform if the market really has a big pullback? This concept is known as identifying relative weakness. So lets drill down into the Energy sector to see what individual stocks deserve our focus.
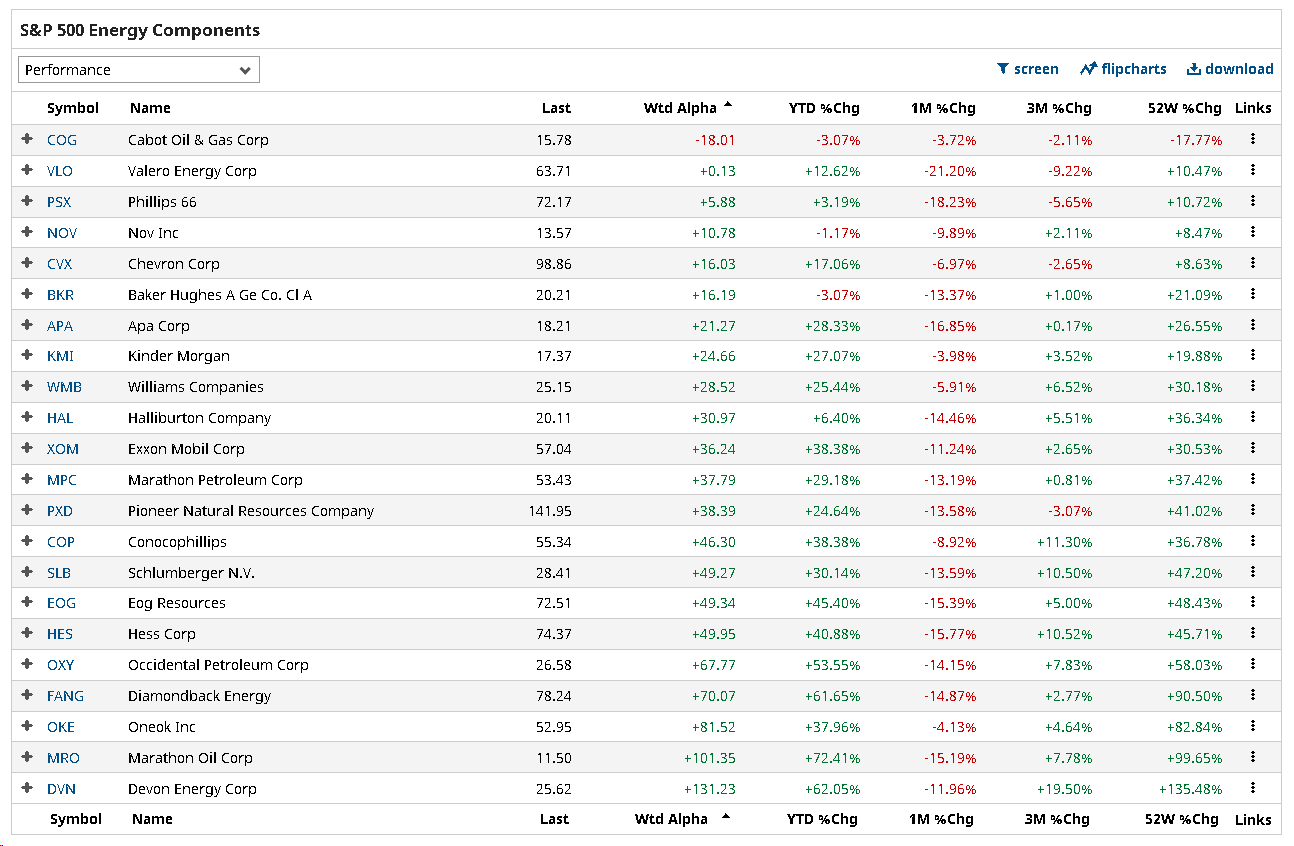
So this gives us a great place to look for follow-thru weakness if the market were to turn. I’ve sorted them by their weighted alpha, weakest to strongest. Just another tool in your bag to keep your game on point.
LONG SETUPS
Strong Stocks Looking For Continuation
$TTD
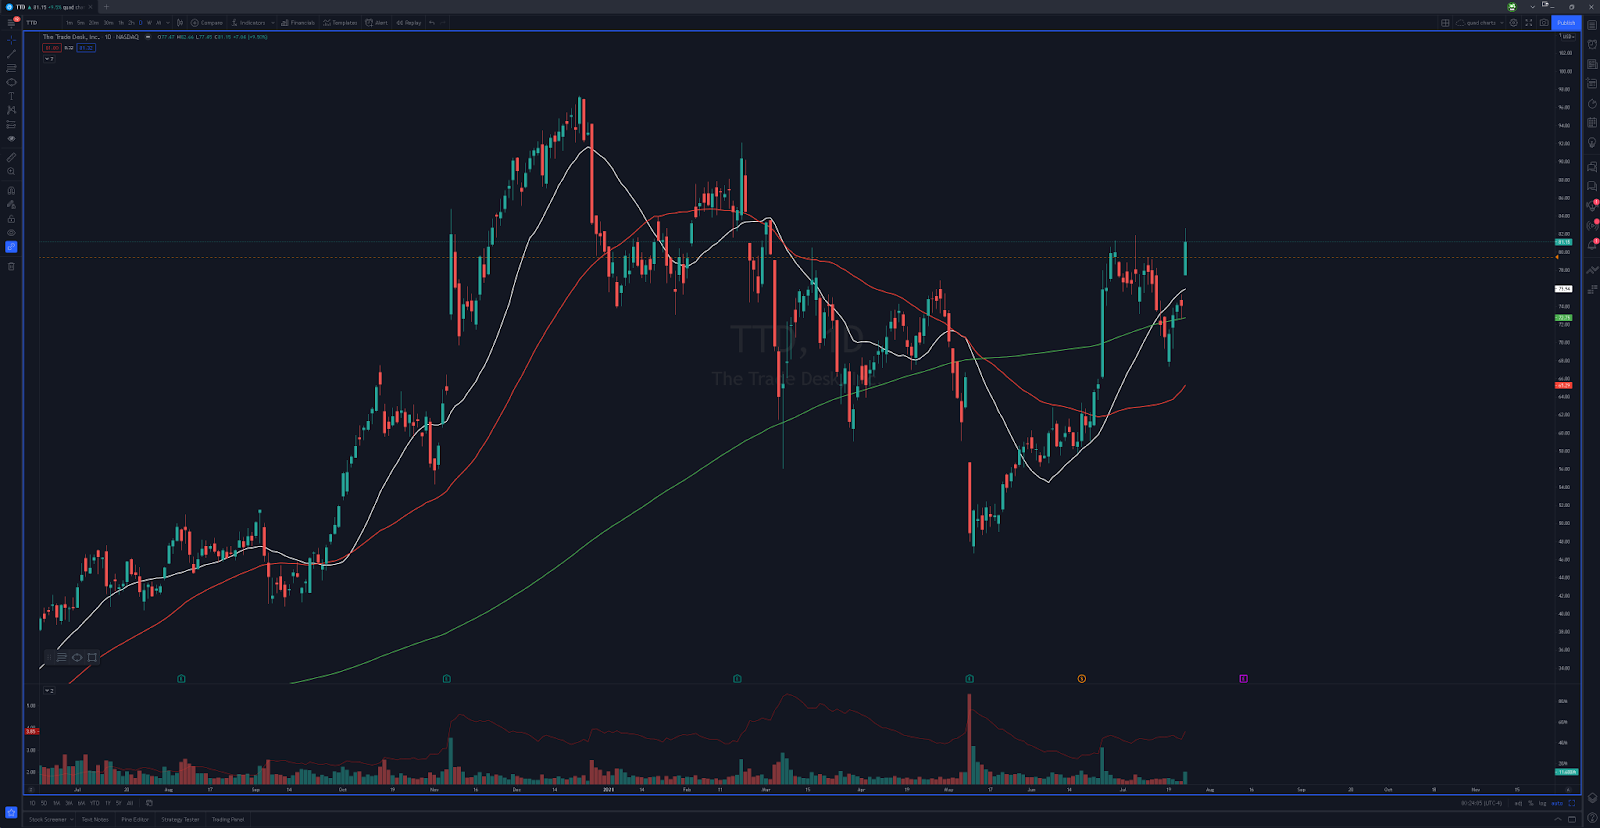
https://www.tradingview.com/x/VBDag7MG/
Big volume day with a nice big green candle. Technically it broke out over that 82 level, so now I would like to see pullbacks hold some support.
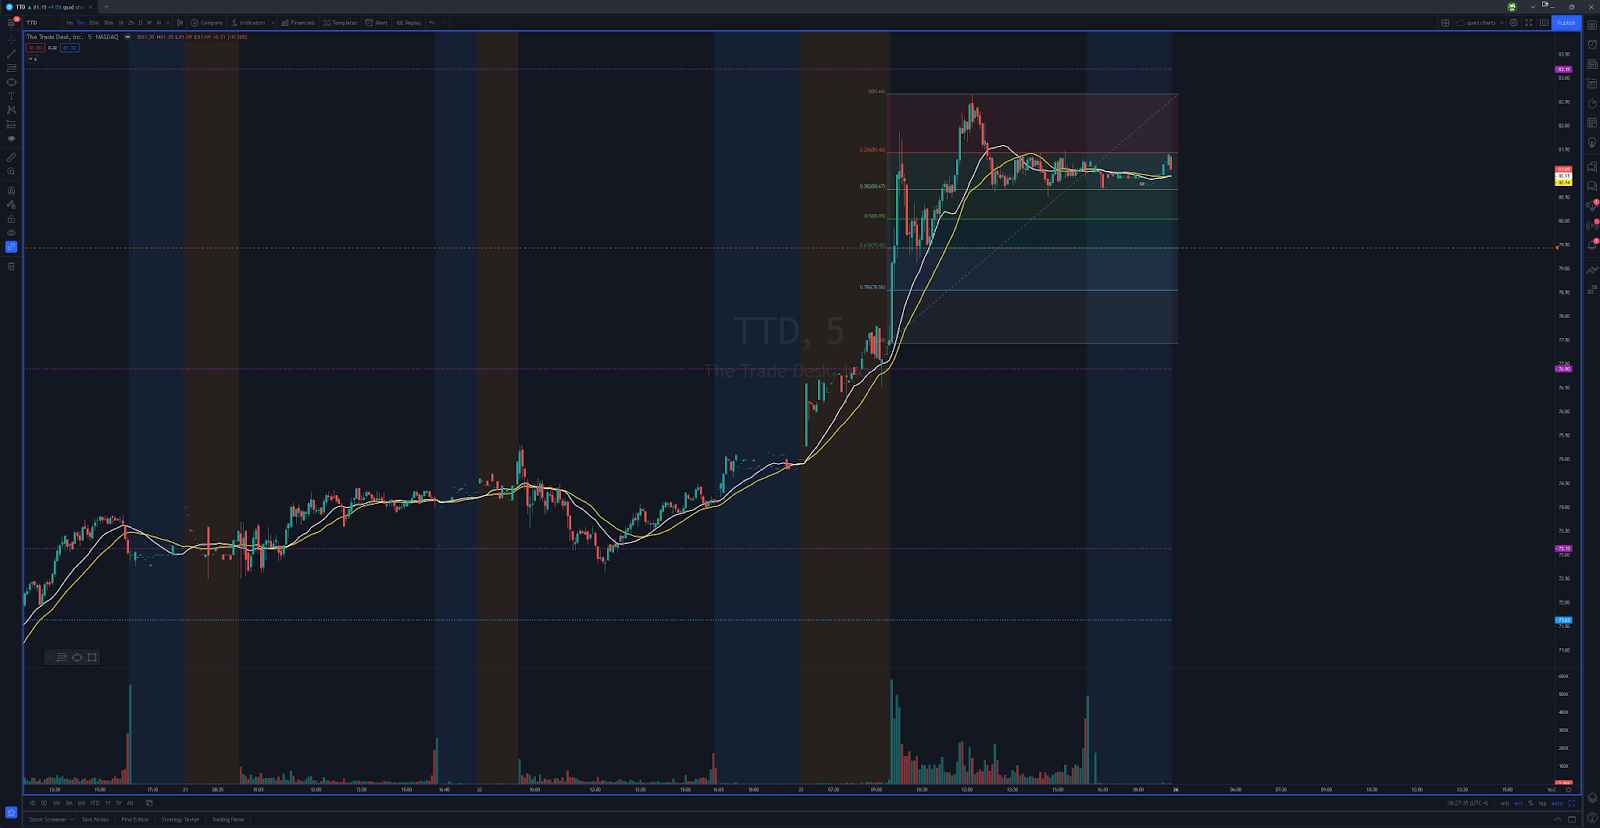
https://www.tradingview.com/x/orcxpxF8/
You can see the dips on Friday held around 79.40s, which also is right at the 61.8% fib level. Thinking any early flush to that area on Monday can be watched to see if they support it. If they gap it up, you can always look to join trend, but keep in mind that if they gap the broader market up as well, I would be very hesitant to get long anything until we get a backfill of the gap and we see buyers show up.
Other names that closed strong on Friday were $SNAP, $ROKU, and $FB. But since I want to see the market take a breather, I am going to keep the long ideas to a minimum this week. Trust me, I have a TON of longs on watch, but there’s no need to throw a million names on the list if the market isn’t set up for them.
Oversold Reversion Setups
Nothing grabbing my attention for this category
SHORT SETUPS
Weak Stocks Looking For Continuation
$PSX
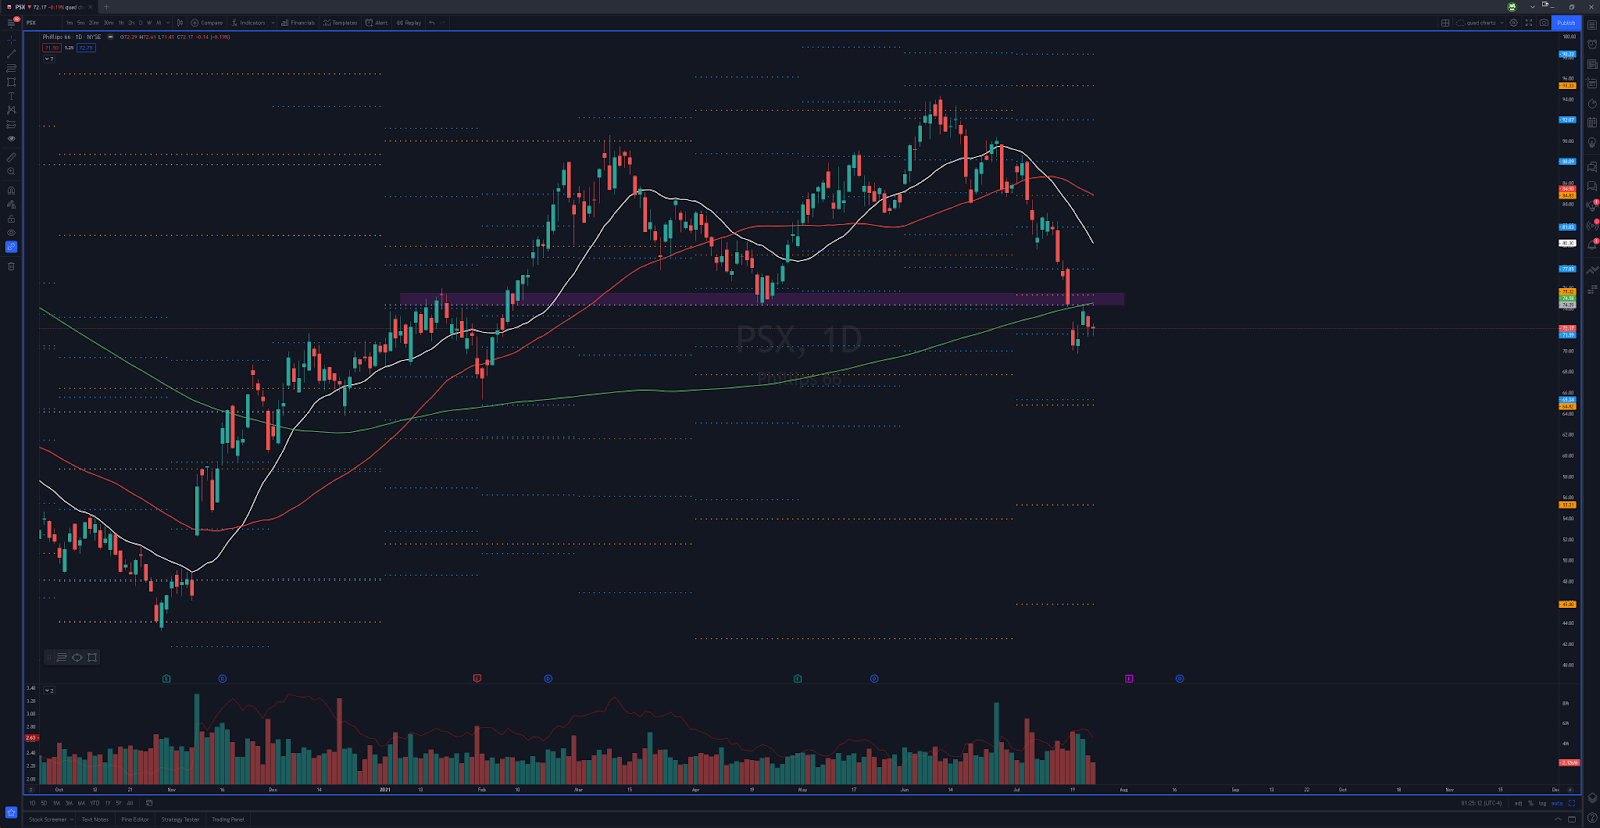
https://www.tradingview.com/x/h1pij9Gg/
Hmmm, now where have I seen this name before? Oh, that’s right! It was from our sector analysis earlier where we identified the relative weakness. With an ATR of 2.6, any hard pop back into the 200d should offer a nice opp for a fade. Would even consider leaving room to add at the quarterly pivot at 75.32.
$SKLZ
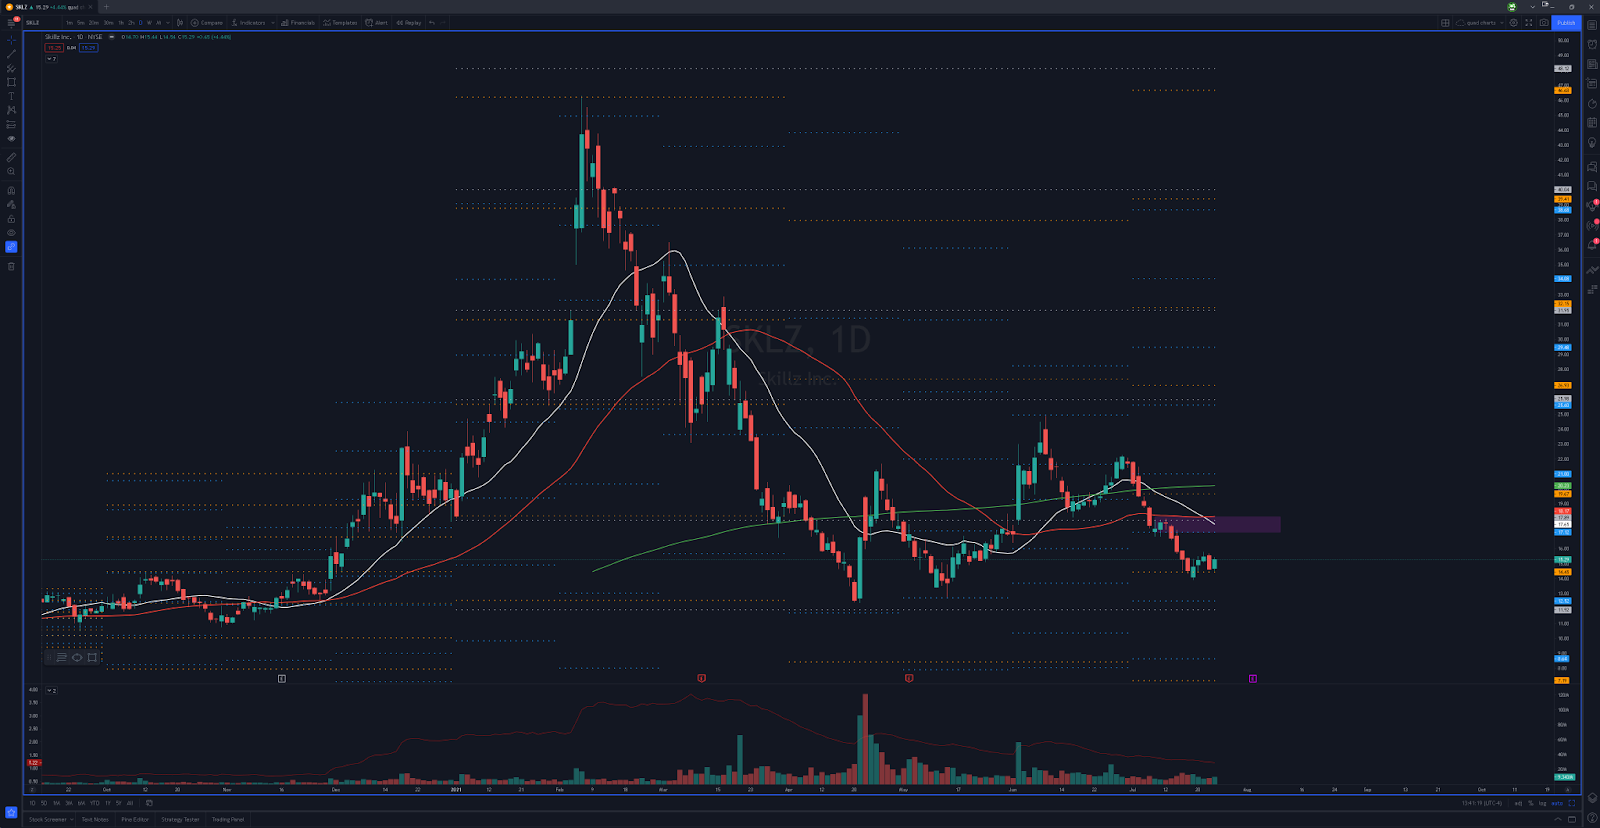
https://www.tradingview.com/x/VbrNroQ3/
Any push back up into the underside of the 20d/50d/monthly pivot/annual pivot area of confluence should offer some extremely strong resistance. Of course the more emotional the push into those levels is, the more I like it.
$TTWO
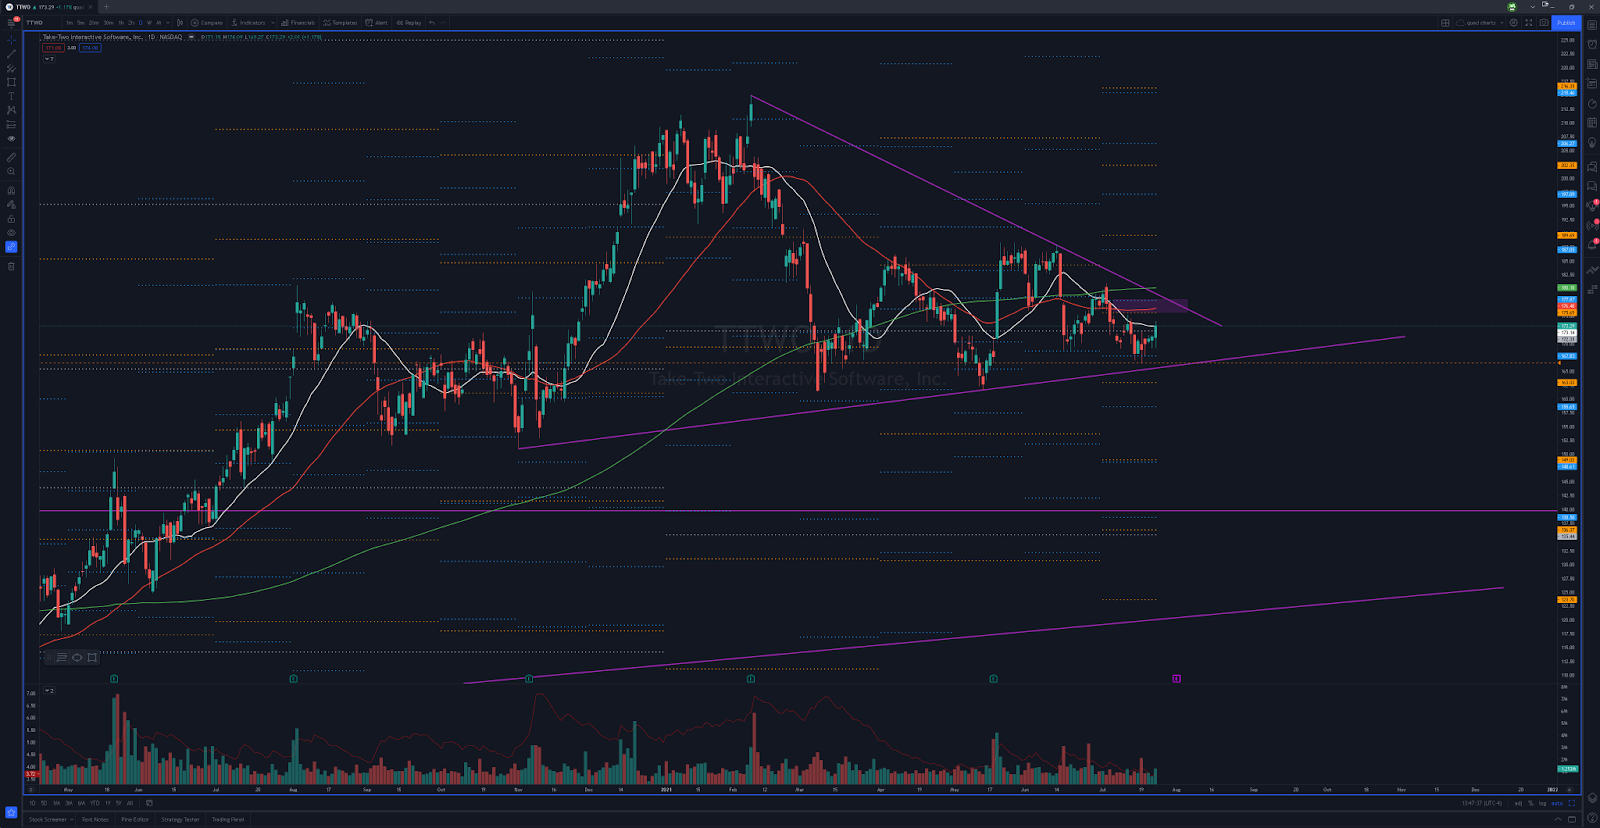
https://www.tradingview.com/x/PXTJNeUy/
2 ways I see to play this ticker (yes, that’s slightly punny). 1. Short a pop back into the underside of the quarterly pivot/50d/monthly pivot area if it can shove up there quickly. 2. Wait for a break below 166.61 and then look to join trend.
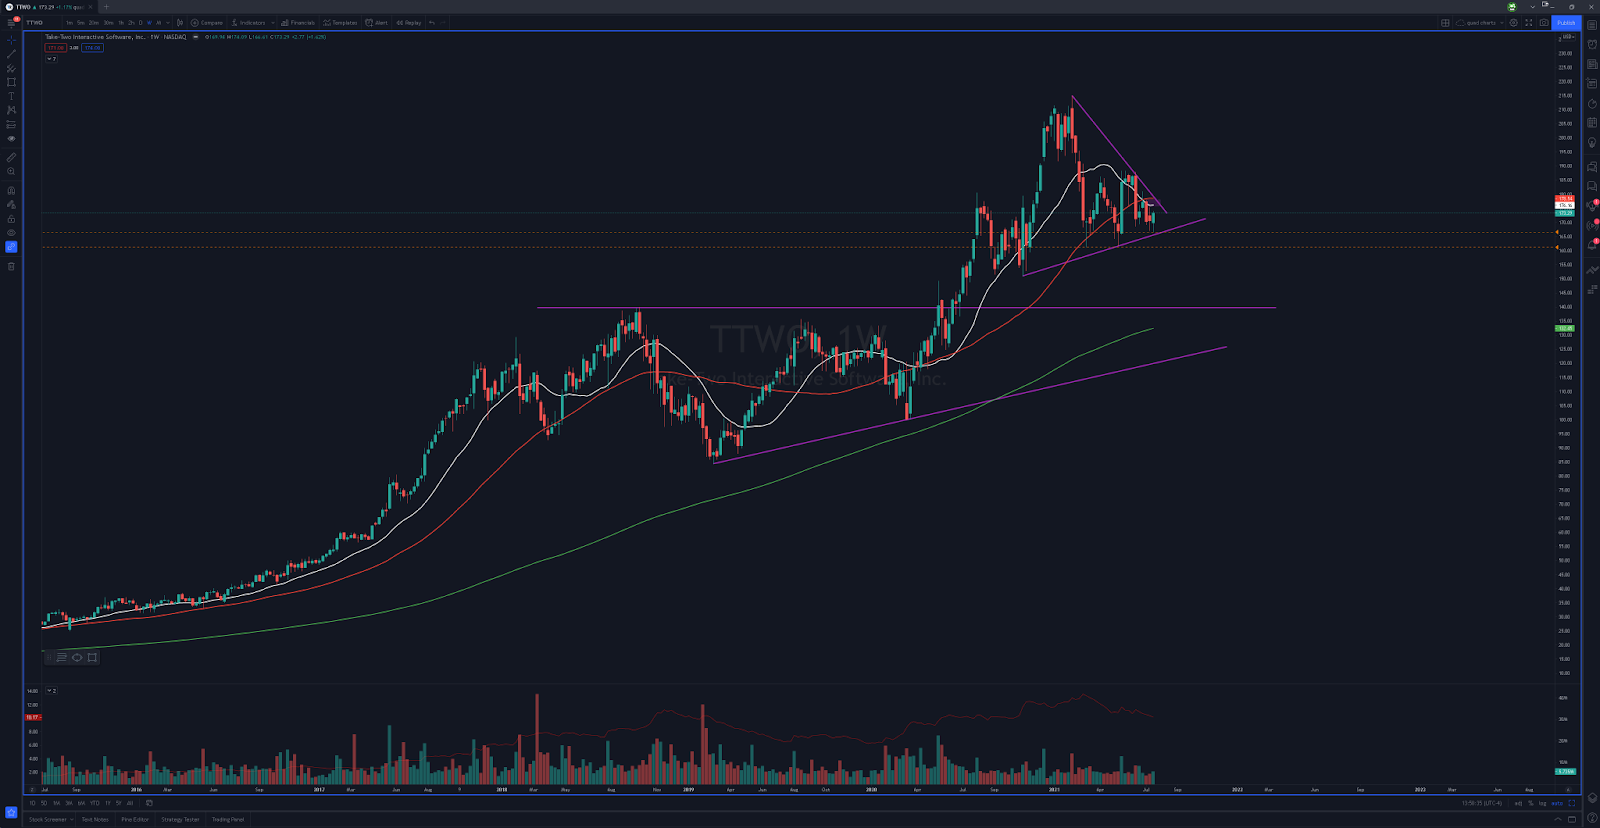
https://www.tradingview.com/x/lSZSYaXP/
If we lose that 161.33 low, I really feel like this has the ability to come all the way down to retest that 140 breakout level from way back. Make sure you understand when I discuss these bigger moves, I’m not referring to near-term, but more likely to take a month or 2 to play out.
Overbought Reversion Setups
$SBUX
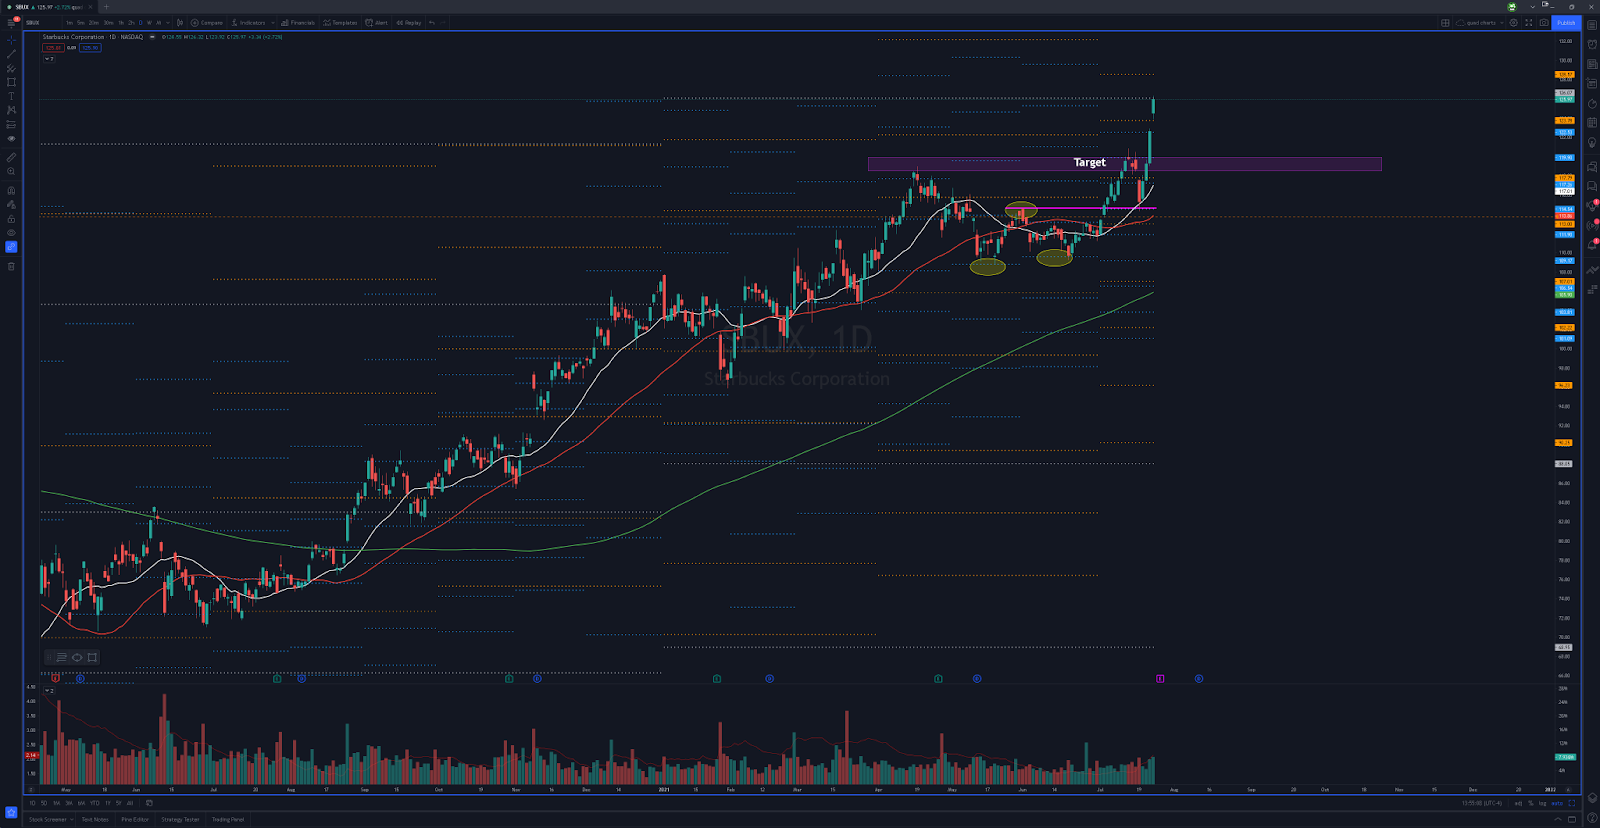
https://www.tradingview.com/x/jMNY9xSo/
This thing has REALLY ran since we first pointed it out for the possible long setup. But it’s now getting to the point where the move seems overdone. As always, my opinion doesn’t mean SHIT! But I WILL be prepared to fade this if it starts to have some lower highs set in and gives me somewhere to have defined risk. Best case scenario is another day up extension to get it that even more extreme look. 130s would be AWESOME! But I’ll take what the market gives me.
EARNINGS
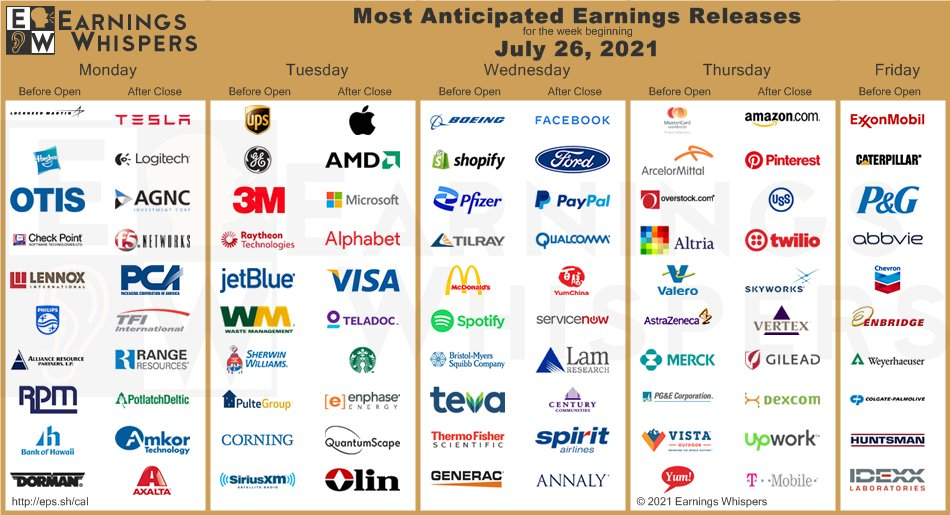
Here is this week’s lineup. It’s a big week, so I’m gonna focus on the names with the best charts. There will be PLENTY of names that I don’t put on this prep that I will still be watching like a hawk, so make sure to do your own homework.
$TSLA
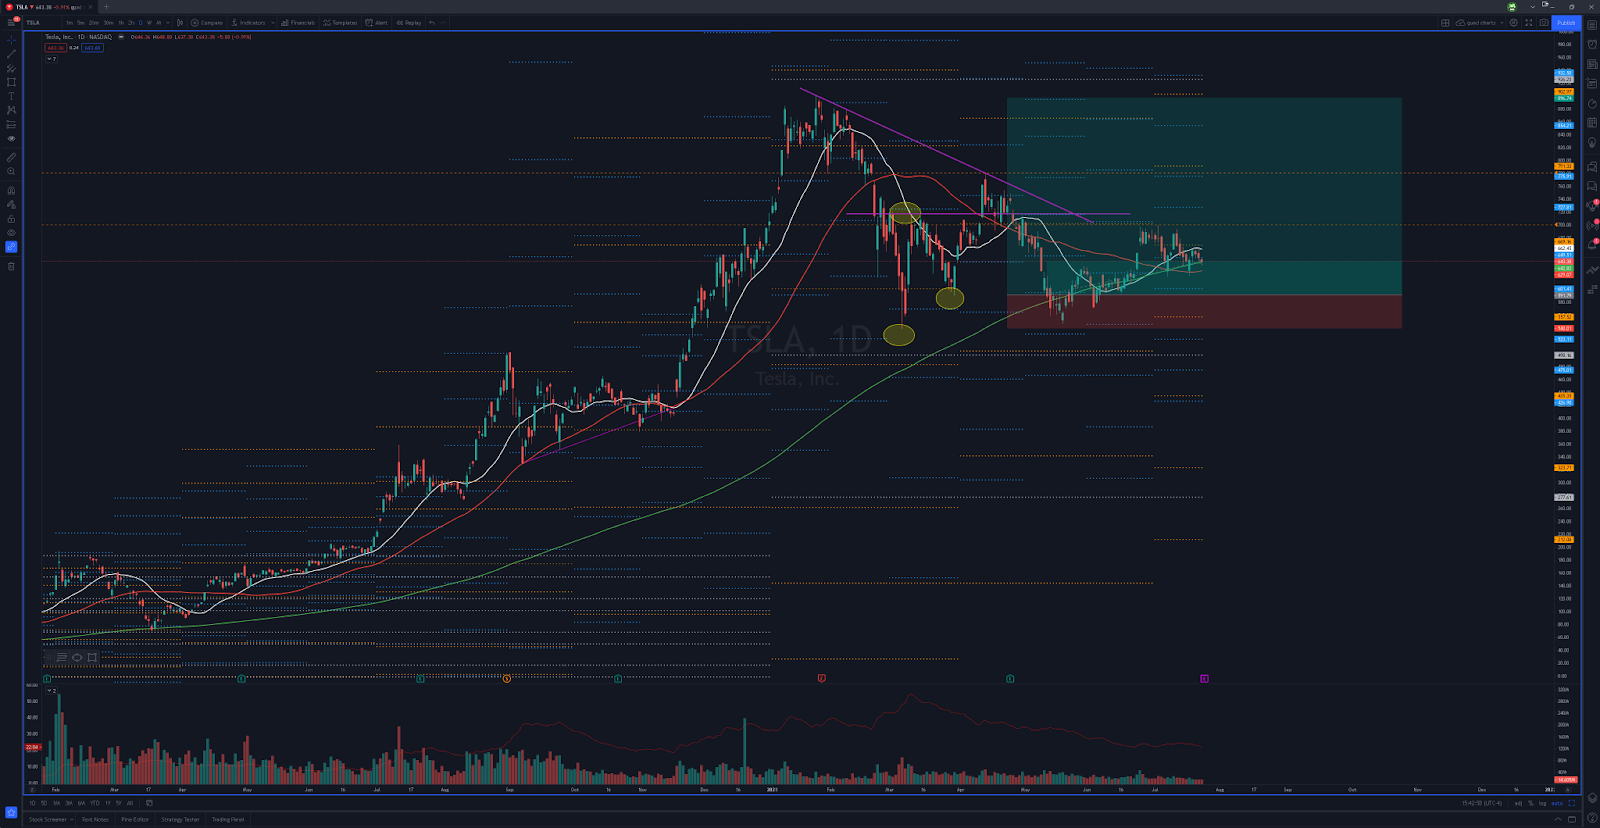
https://www.tradingview.com/x/1s74hFir/
Remember, the swing idea from a few months ago is still valid, so if you’re idea is to play the longer term long on the name, you can still view any pullbacks towards that 580-600 level as good entries with risk under those March lows. Over 700 and this thing looks like it can get frisky. I really don’t like the short idea on the name unless we were to convincingly break under those March lows and then I might consider pops back into levels as possible short opps. Only other way to short the name is on EXTREME extensions and those are not trades I would overstay.
$UPS
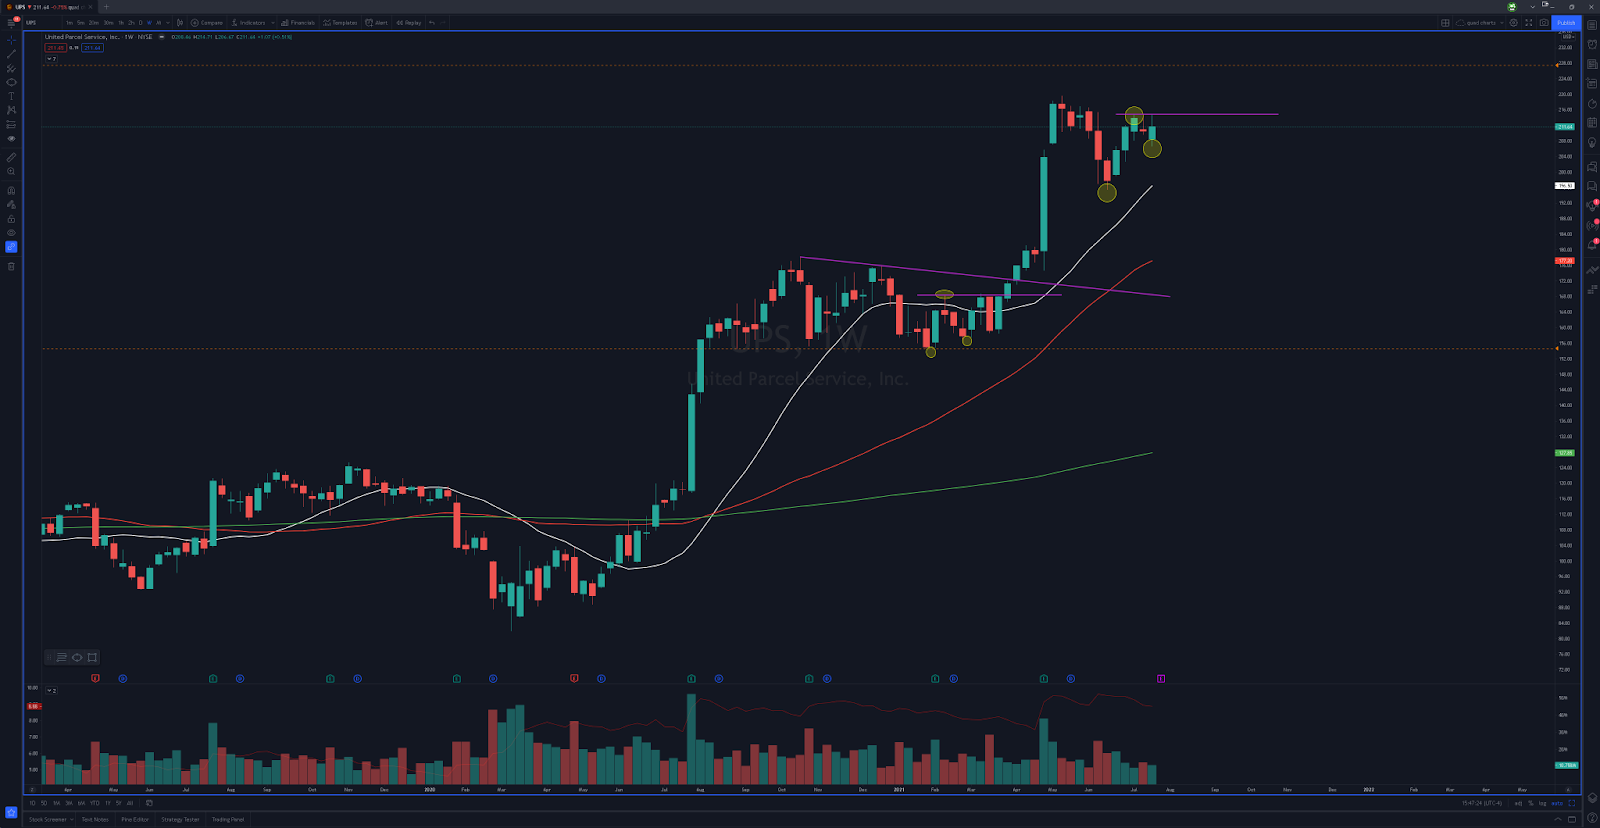
https://www.tradingview.com/x/mvb8s1cD/
Nice looking weekly chart here. Feel like over 215 and she goes straight up to ATHs and possibly next leg up. Only concern I have is that it really didn’t spend a lot of time building this new base. If they miss on numbers, I think it can flush down to the 200 level which should probably be a good level for scoops. I don’t think a pullback to that area hurts this stock at all. Think it would be just what the doctor ordered so that the infant base can spend some more time maturing into a teenager before eventually flying the coop. You also have a quarterly pivot and a monthly pivot at 198.8 and 196.78 respectively.
$MMM
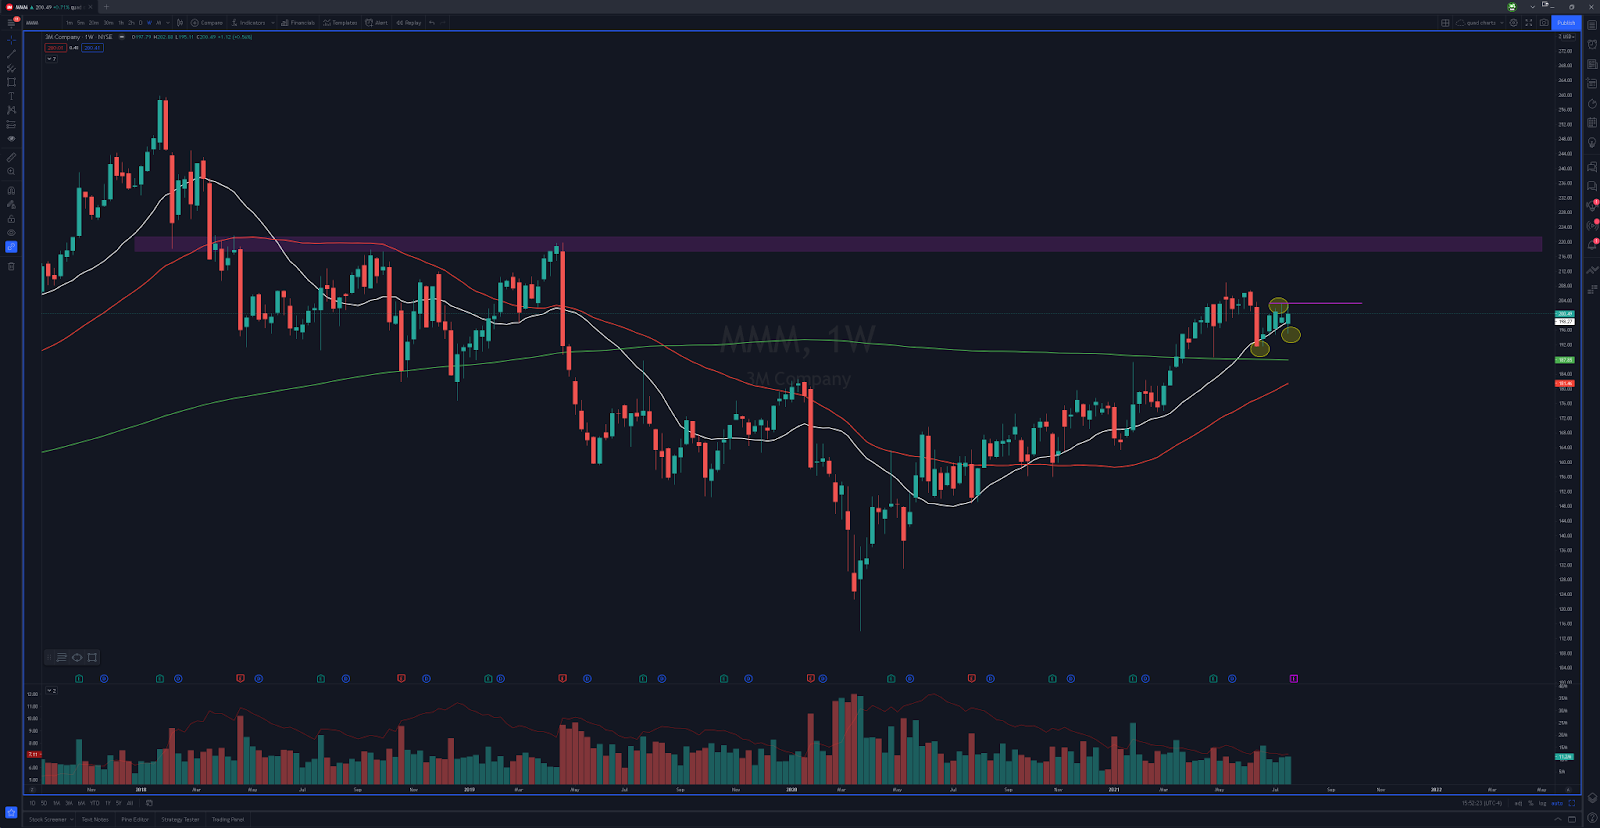
https://www.tradingview.com/x/Hubs5Upn/
Not gonna lie, this chart right hurrr gets the blood pumpin’ a lil bit. Over 203.21 and we might get some nice fireworks. Obvious first resistance would be that 209 area, but if it gets through there we may be en route to 220.
$AAPL
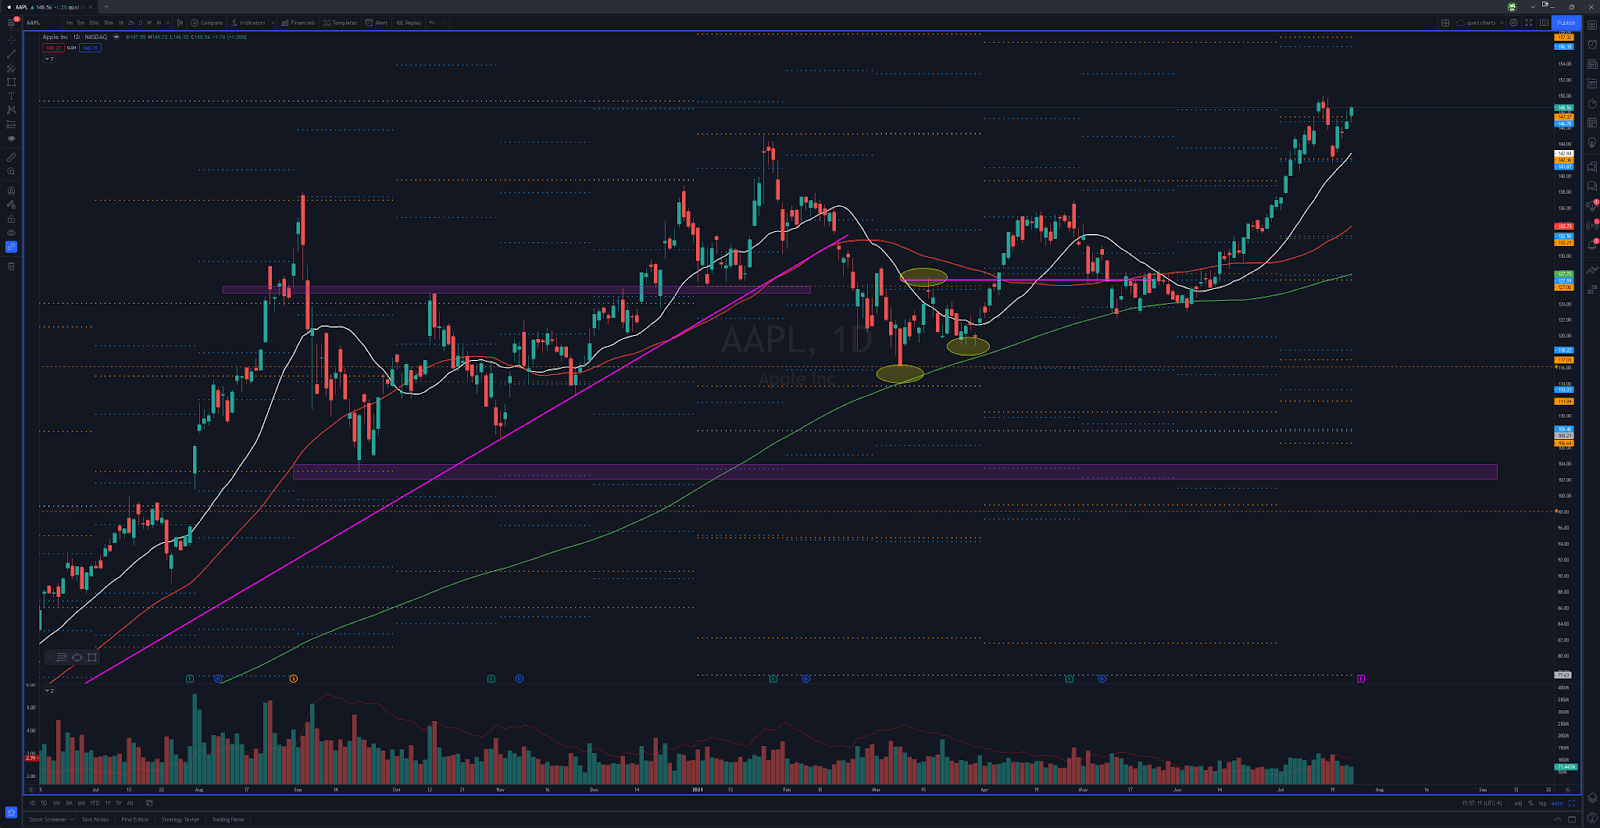
https://www.tradingview.com/x/xPScOALm/
Here’s one of the behemoths. And trading at ATHs. Can they surprise the street enough to continue higher? Hard to say. But I can definitely say that if they disappoint and get smoked, we may get that pullback in the market that we were discussing earlier. This doesn’t make me bearish, not at all. In fact, I actually would love a pullback to some key levels on this name to reset the market and also give some possibly great entries on such a great stock. Would want to see the 50d before considering starting in long, and possibly even the 200d.
$MSFT
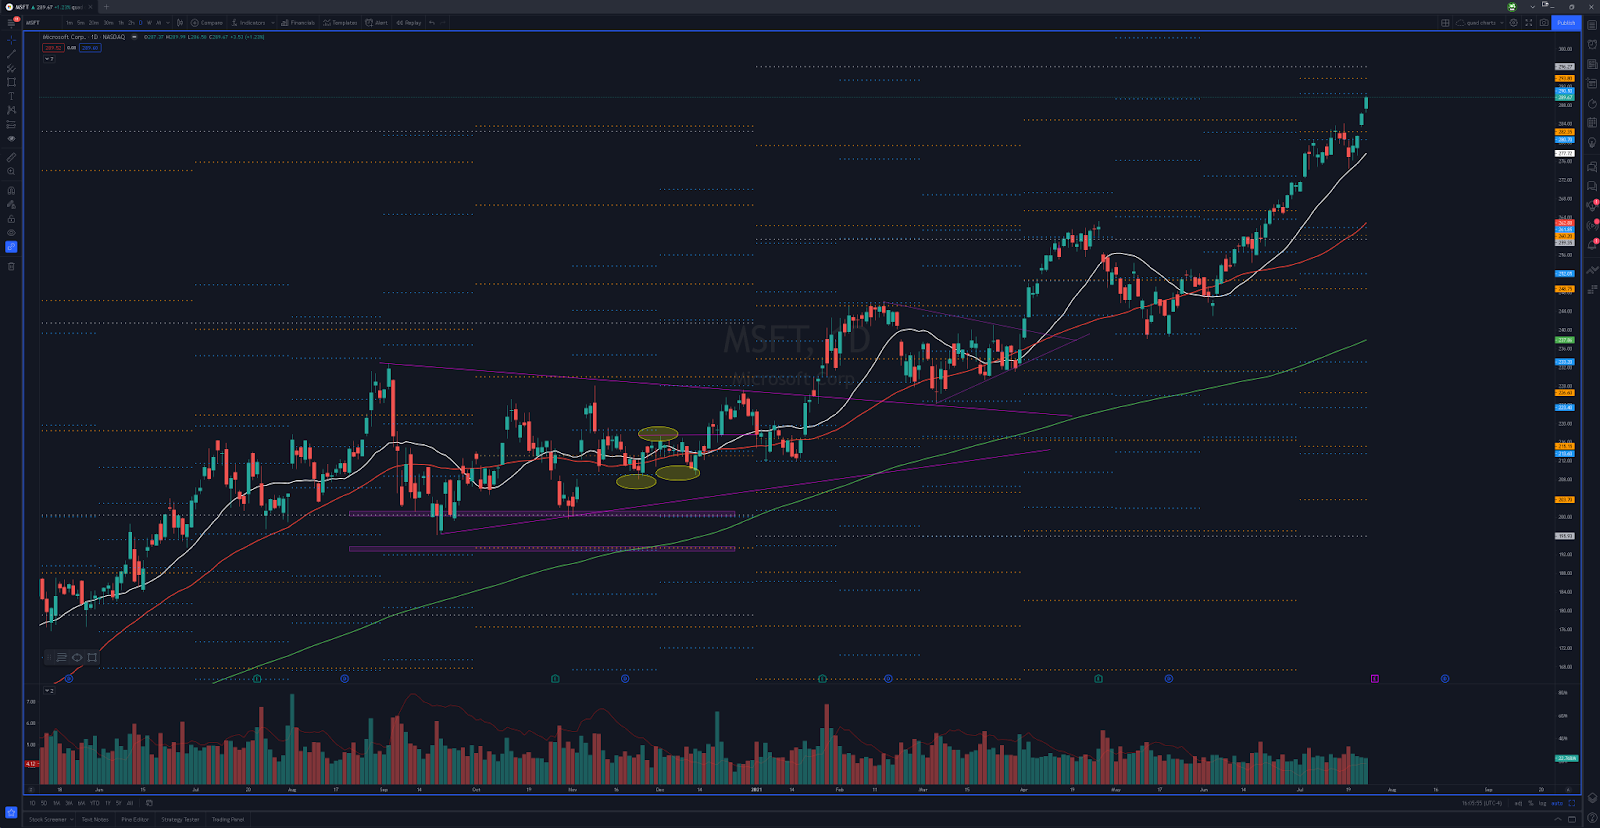
https://www.tradingview.com/x/qTruRlDN/
Another one of the big boys, and again, trading way up at ATHs, and this one is pretty extended (in fact I sold all of my swing long from my SEP account last week). What could go wrong? LOL. 260s would be the first spot where I might think this has pulled back to levels where I might feel comfortable again in the name. If we get down there, I would entertain both day trades and possible swing trade entries. But if this gaps down towards 280ish and then starts to push back up and make a run at some reclaims, I very well may look to get short the name.
$GOOGL
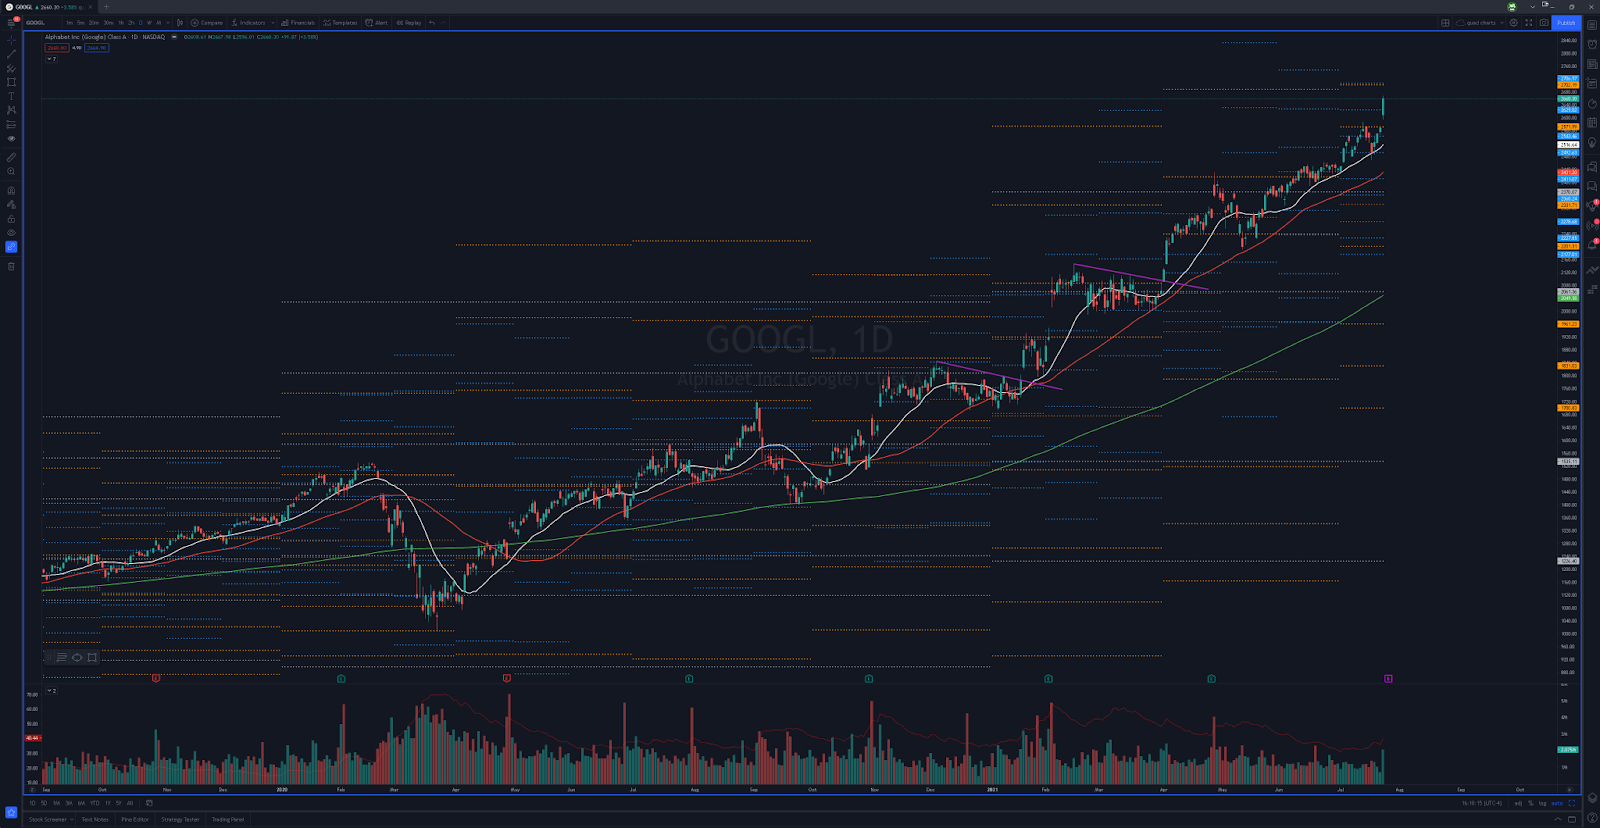
https://www.tradingview.com/x/YfAytRT7/
Another giant, another extended chart trading at ATHs. At this point I’m considering going back in the prep and just cancelling all long ideas. LMFAO. First area where I feel the support would be healthy would be low 2300s. Most likely won’t trade this name, but will definitely have eyes on this (as well as all the other big names) to see what to expect in the rest of the market.
$AMD
Leaving this name out because I think the chart looks like complete shit. But there are definitely levels where I would entertain longs or shorts for day trades if it flushes or spikes emotionally.
$BA
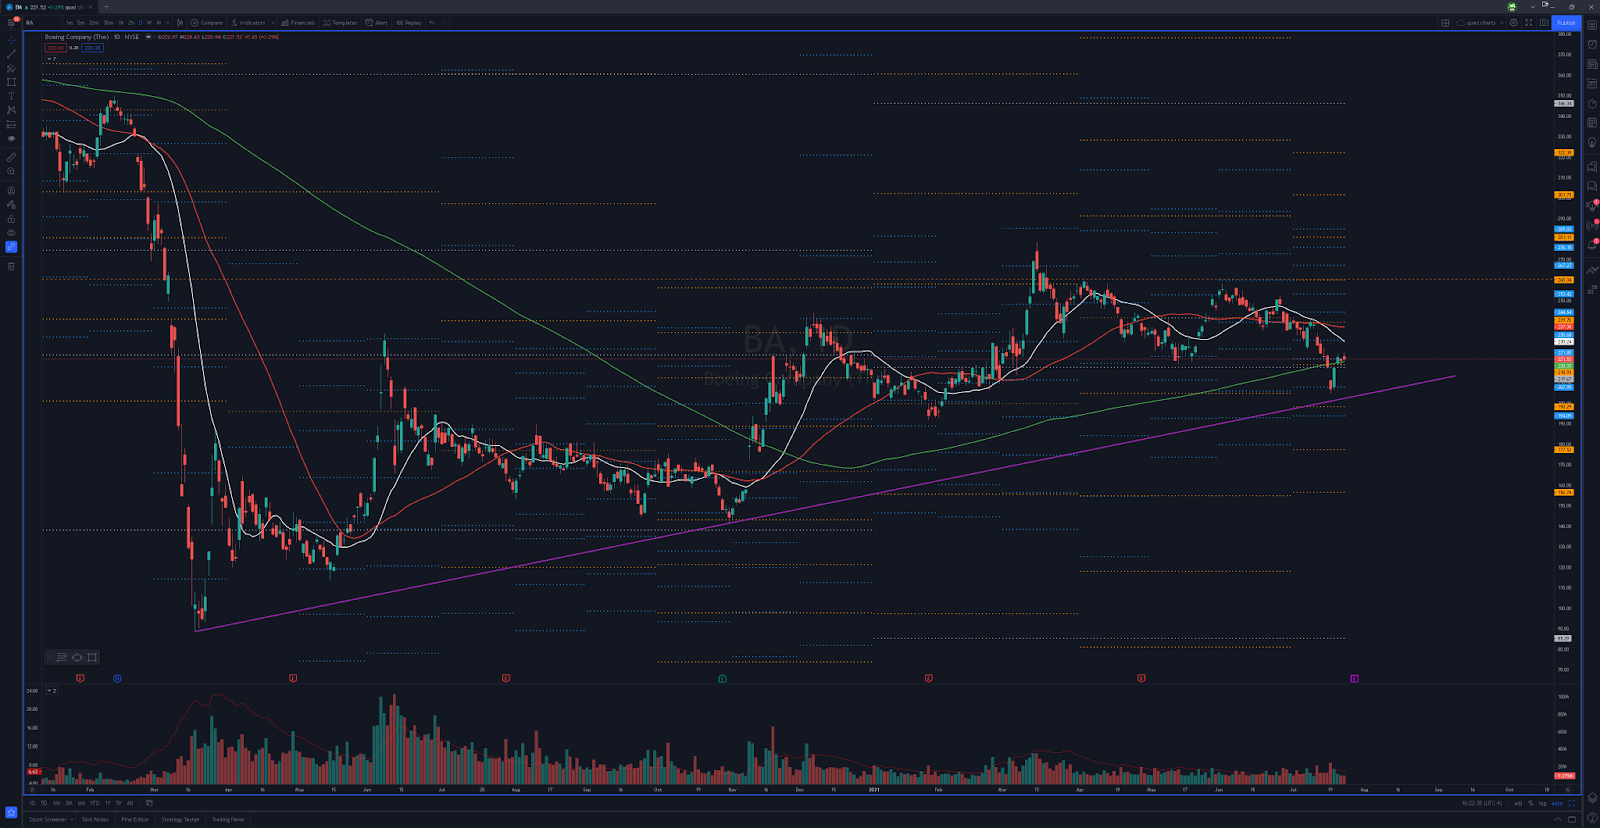
https://www.tradingview.com/x/cyG1s21R/
Boeing has the same chart as $UAL and most of the other travel names had. But if you look at them, they all recently lost their lower trendlines and then weakened. Will Boeing do the same? I think a hard flush down to the trendline would be a good area to try to bounce it. I like the 208 area with risk under 204.8 lows. I think a beat on numbers and a spike into the 50d is where I might take my shot at the fade.
$MCD
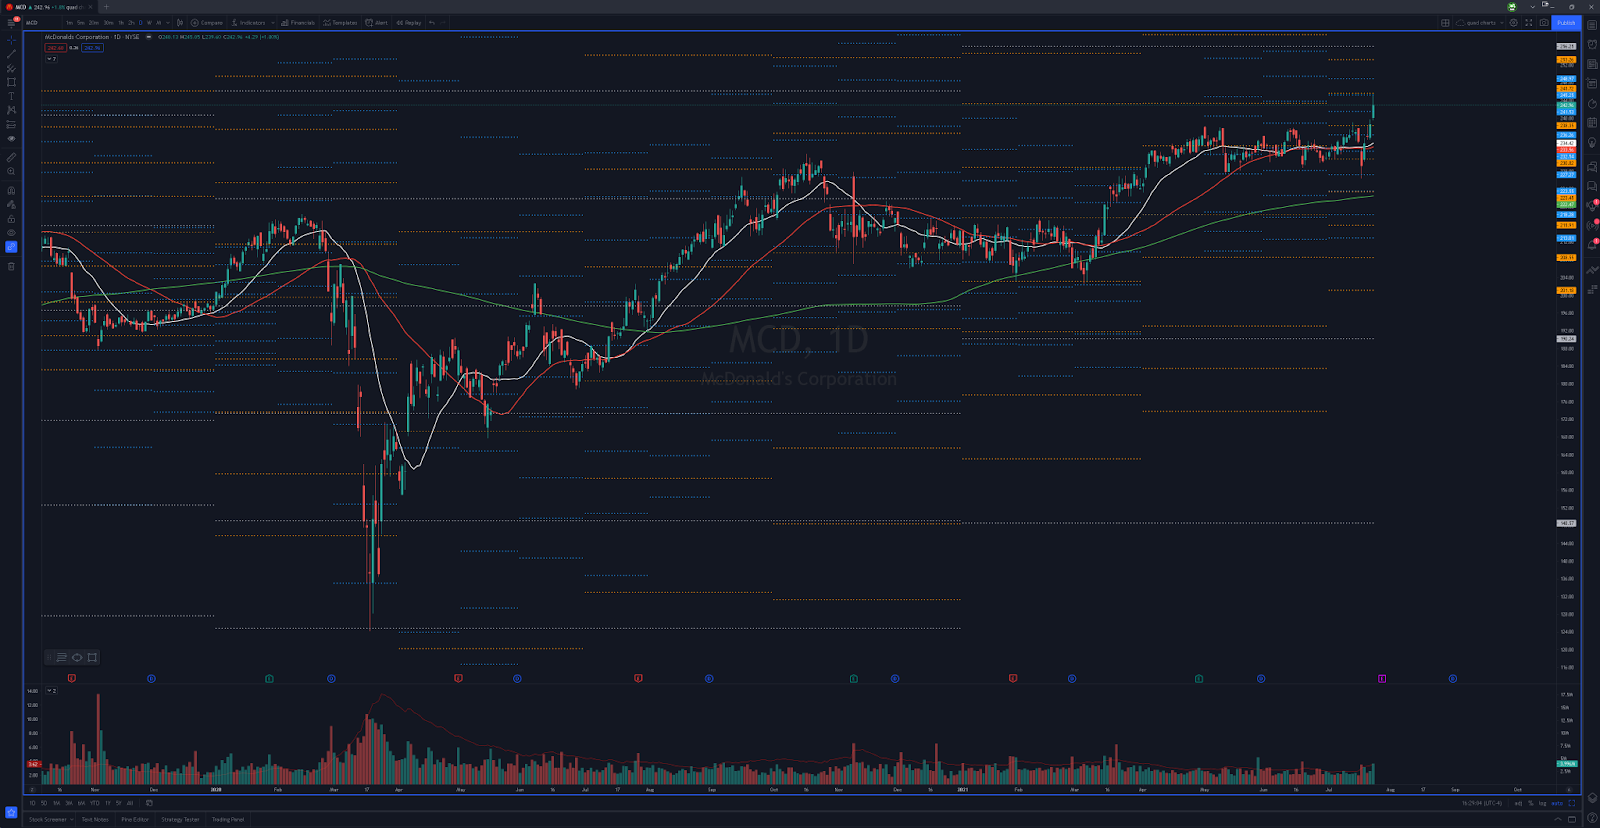
https://www.tradingview.com/x/E74FykyP/
Like this chart for scoops on a flush down to the 20d/50d area. Also, not as worried about this name being super affected by a market yank as I would be with some of the other tech names.
$FB
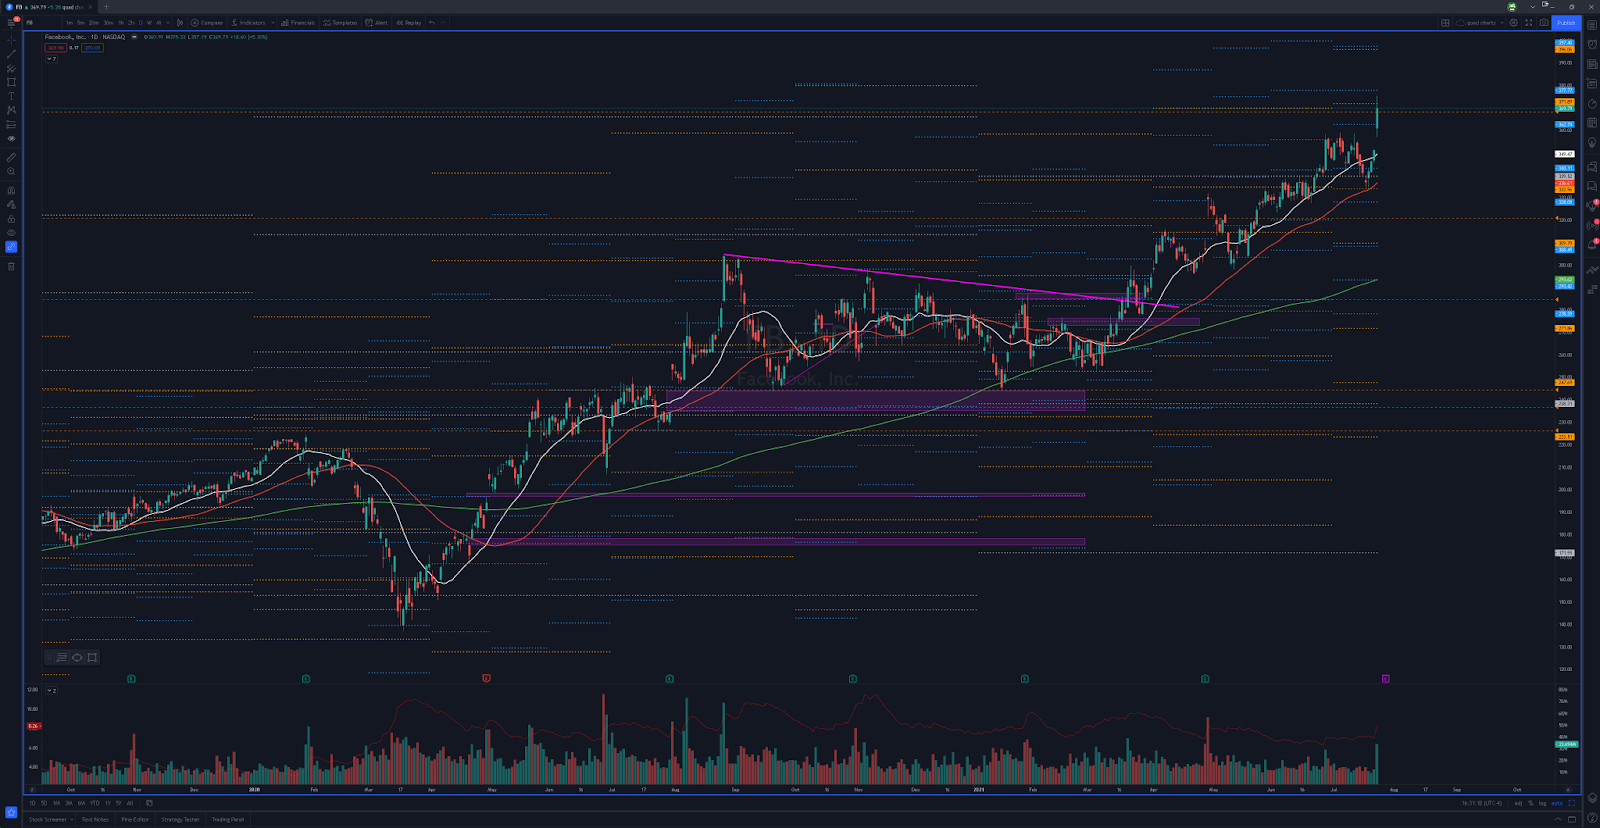
https://www.tradingview.com/x/hnz8qjLQ/
Is it just me or are ALL the biggest names set up just right to simultaneously get smoked and really give this market a test to see if everyone has their seatbelts fastened and their risk-management airtight. Doesn’t seem like the time to falter on your discipline. 320 is the first spot where I feel safe thinking the retrace could be over (IF/WHEN it begins). Why do i like that level? Weekly 20sma. #Facts Will I buy flushes inot the 350 area if they are emotional? Of course. But when things start to look frothy, I don’t stick around in the longs for any substantial amount of time. I’m in, I’m out, and I’m looking for pops to find resistance for possible short entries.
$PYPL
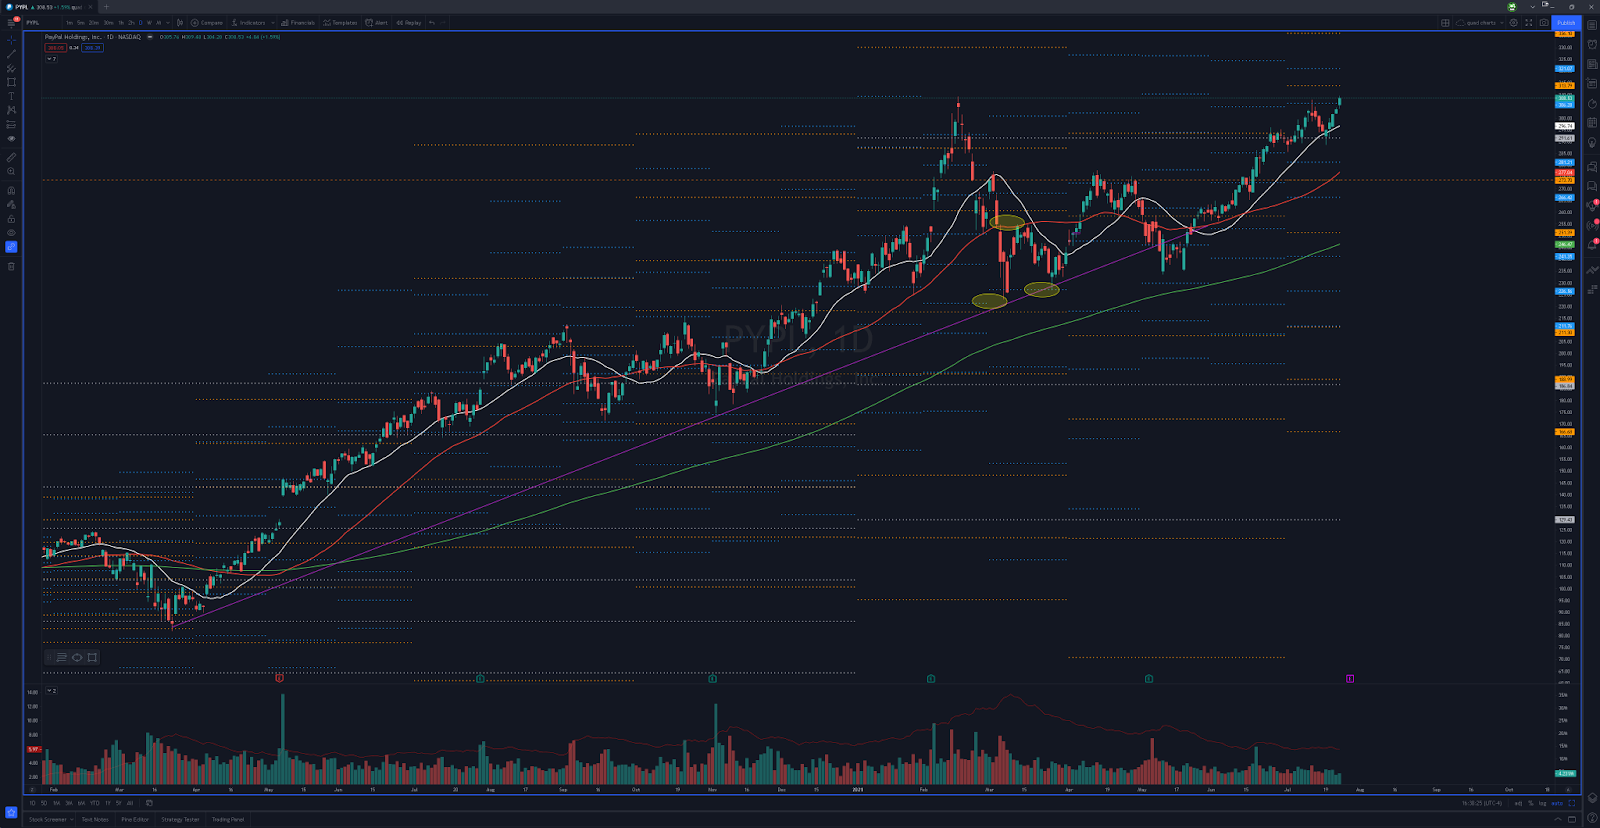
https://www.tradingview.com/x/5h2CTA1V/
And…..
…some more ATHs. Also another one that I sold the last of my swing long on last week. In fact, I have gone into quite a bit of a cash position as of now and will be giddy at the prospect of things going on sale again. A flush on this name to 273-275 is welcomed. Chart definitely looks like it could be ready for another leg up, but again, with the market the way it is, I’m hesitant to be chasing any strength here. Would rather be a buyer on pullbacks and protect myself. Its always better to wish you were in a trade than to wish you weren’t.
$QCOM
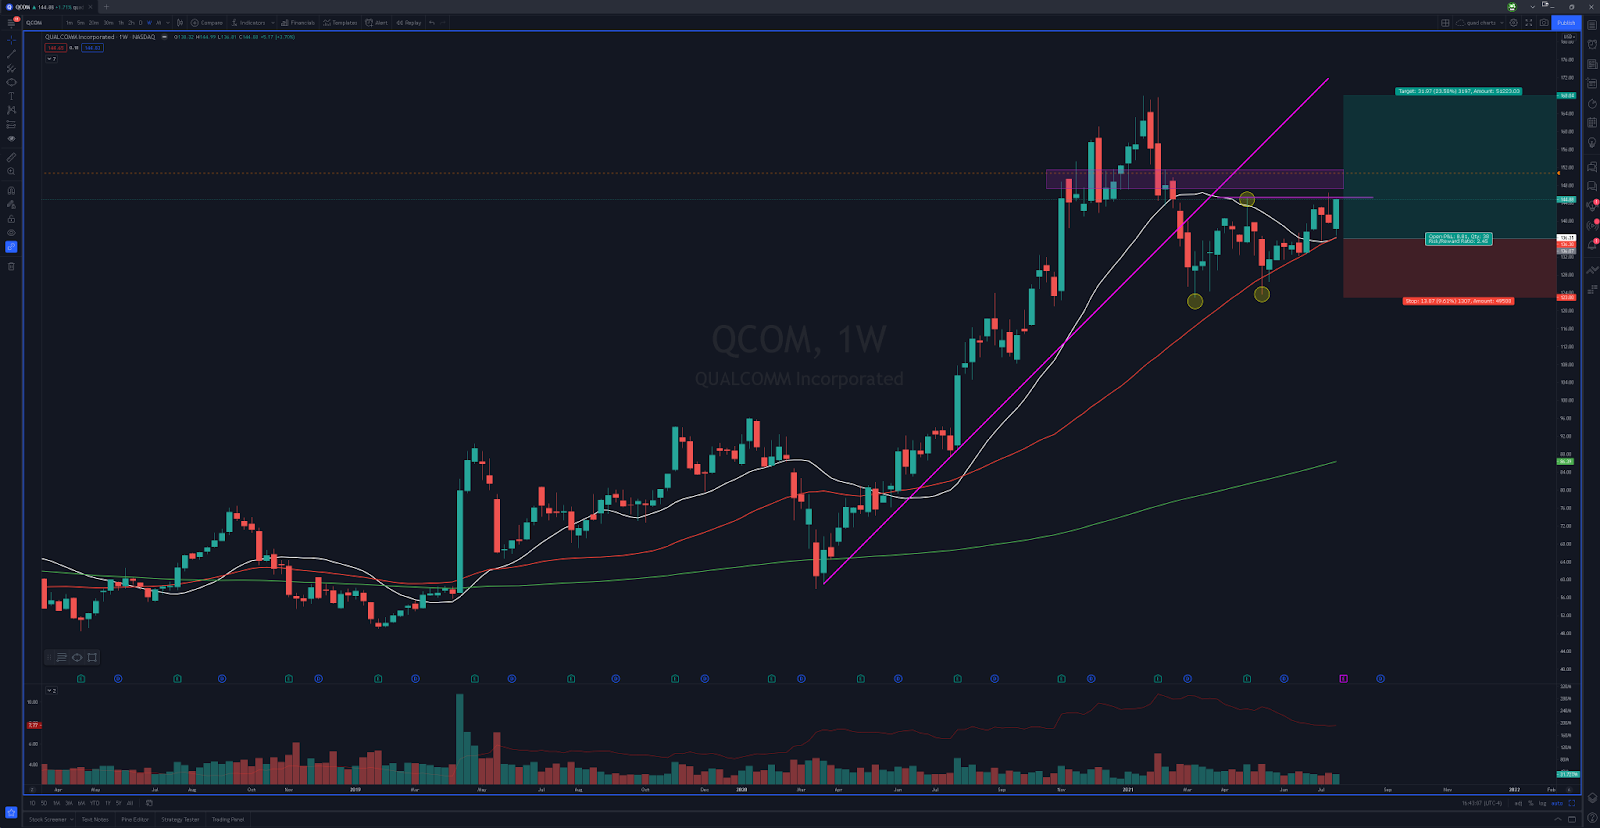
https://www.tradingview.com/x/FCMon6F0/
Here’s a nice looking chart that just recently triggered the long for a swing trade. Hoping that we pull back towards the weekly 20sma/50sma for the entry that gives a nice risk reward on this setup.
$OSTK
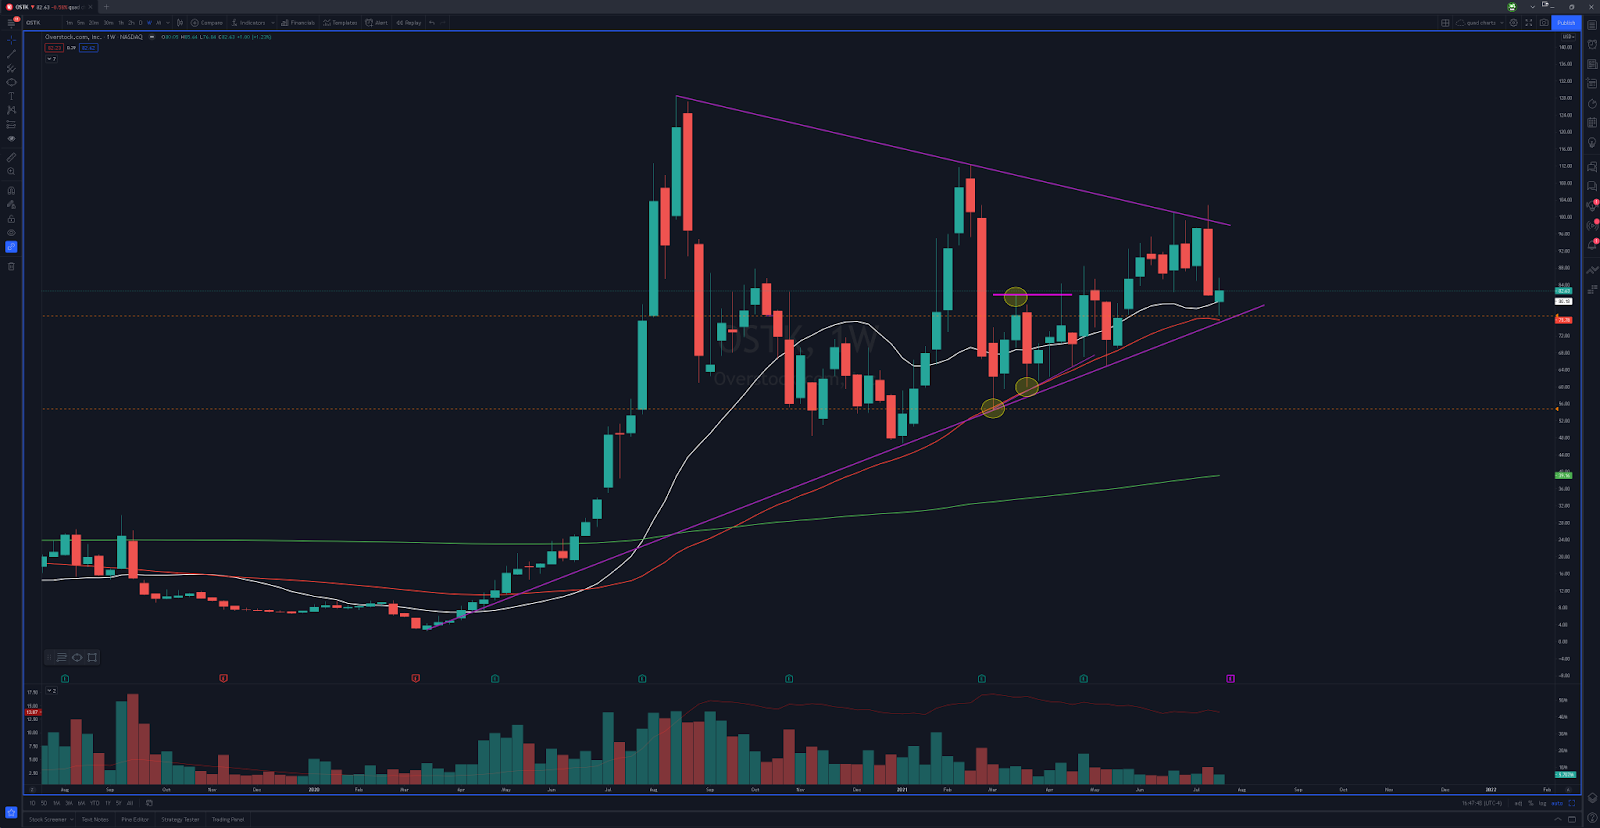
https://www.tradingview.com/x/OcLtsXDV/
Some member of our room have been swinging this thing long since the trigger back in April. And gotta be honest, this thing has behaved EXTREMELY well for those that are in it. This pullback may be such a nice opp that you’ll want to kick yourself for not taking it. But at the same time, I would rather wait till after the numbers come out to see how the stock reacts. Thinking if it flushed to the 200d I might try some long. If they surprise on numbers and the market likes it, you may find me joining trend. Doubt I try to short this name.
$AMZN
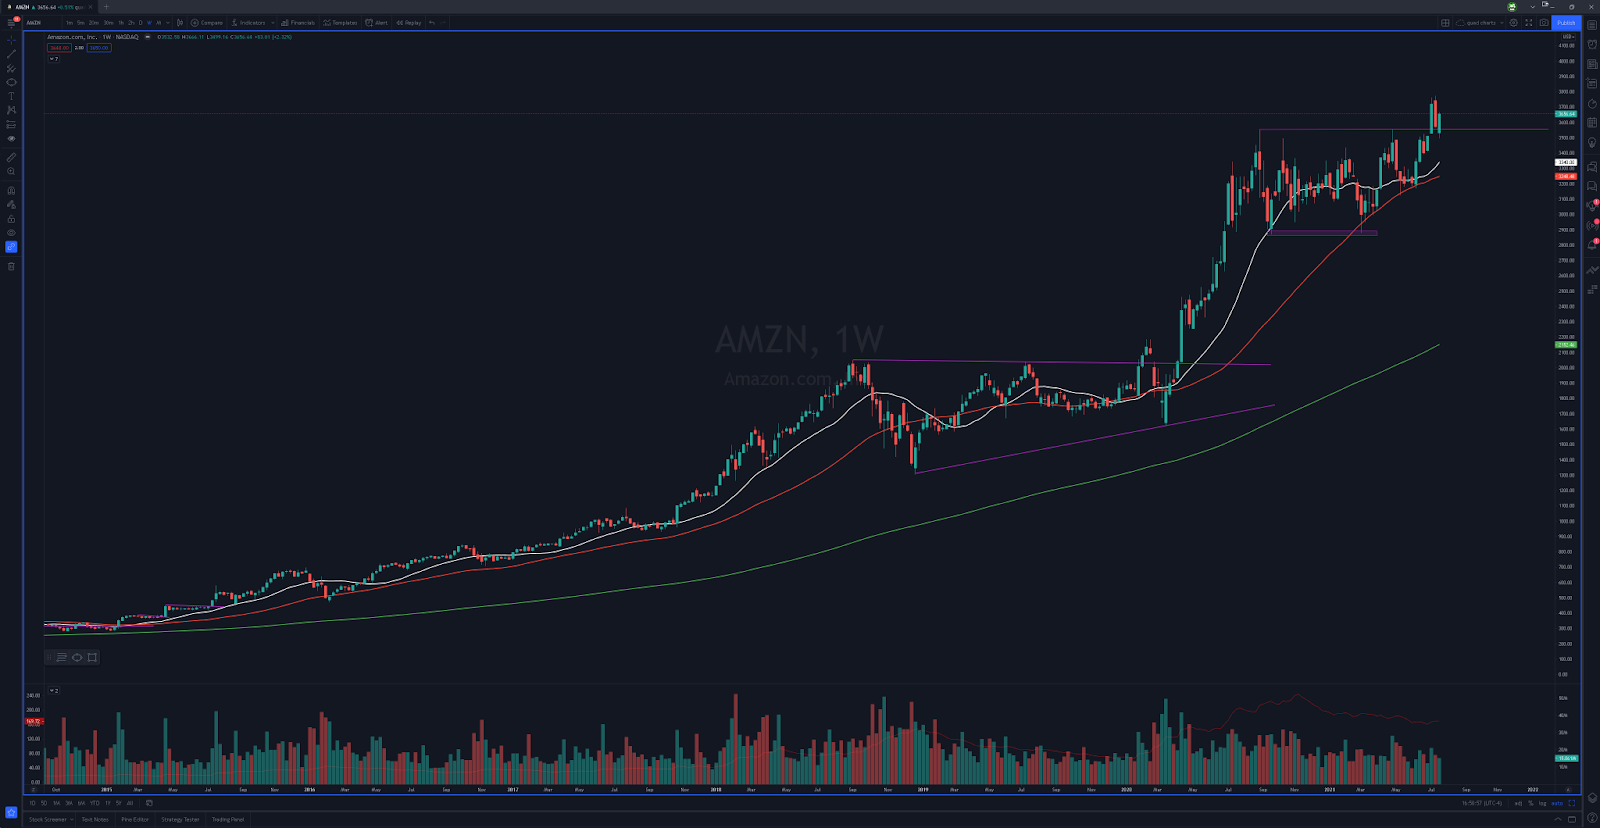
https://www.tradingview.com/x/WBHCkjse/
This chart is a thing of pure beauty. And if history teaches us anything when looking at this, it’s that once it breaks out of its bases and gets ready for the next leg up, it gives the backtest to shake out chasers and give patient bulls the chance to load the boat at the most amazing prices. That’s what I call PRIME. Pretty please on the 3300 retests?!?!? It’s possible that this recent pullback is all she offers, and if that’s the case, there will be plenty of opps to join trend. Remember, when these sleeping giants are awakened, the moves they make can be substantial.
$PINS
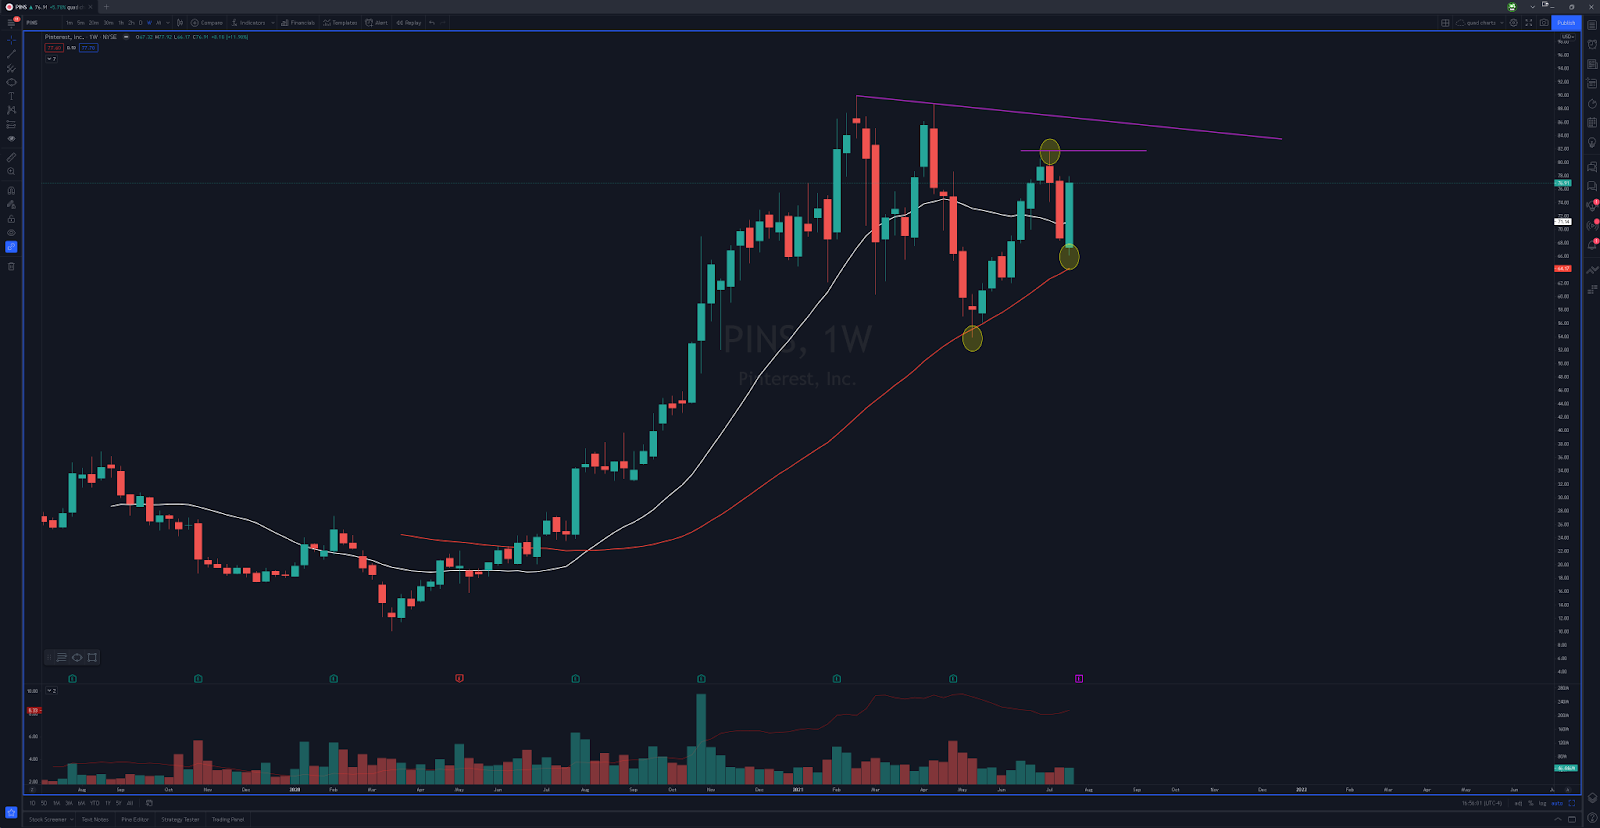
https://www.tradingview.com/x/wvGHyimI/
Not a bad looking chart with the setup there for higher, but feel like if you’re patient you can get better prices after it triggers. That is for the swing idea. But as far as daytrades are concerned, I would be scooping emotional flushes into the 50d/200d/monthly pivot area around 68-69 or I would possibly look to fade an emotional spike towards 85. If it were to gap up towards that level, the next area of interest would be the 90 spot.
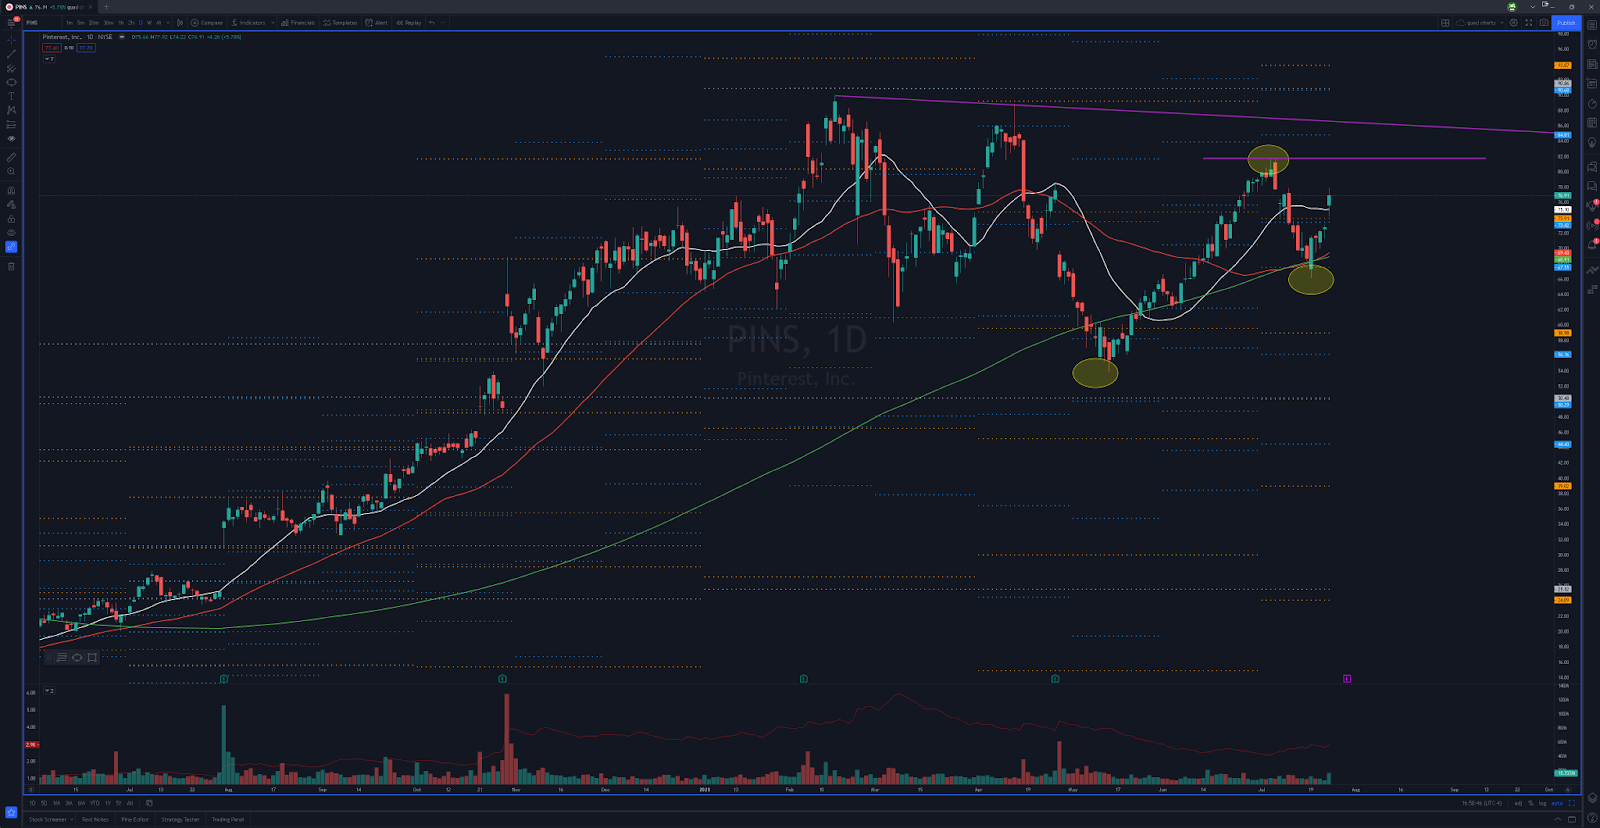
This daily chart should help clarify those levels.
$CAT
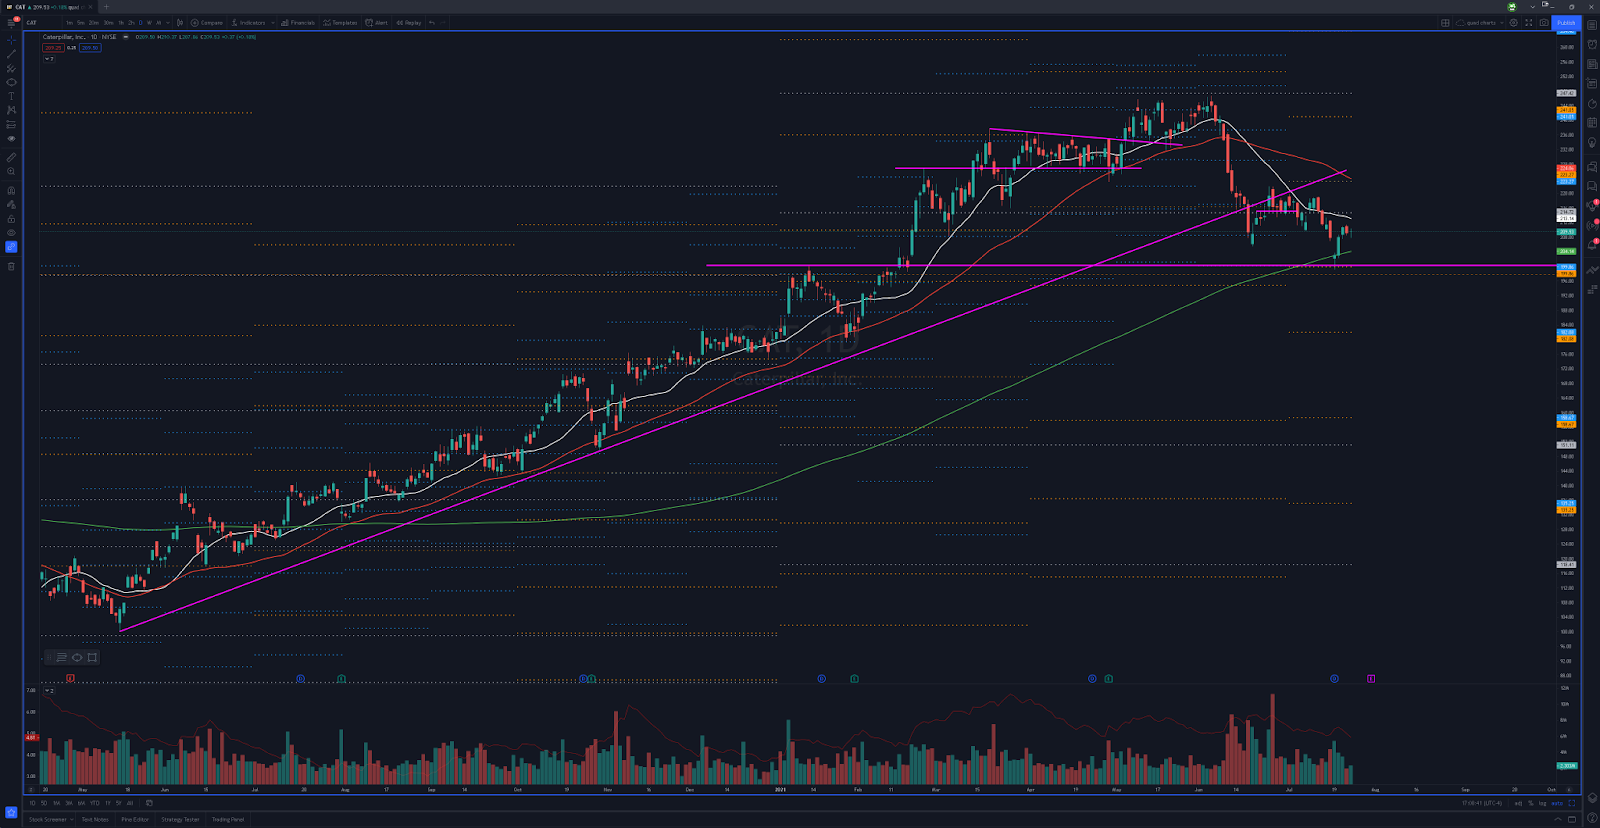
https://www.tradingview.com/x/JYamgTzw/
A spike into the underside of the 50d is where I would look to fade this name. A flush back down to 200 (the dollar spot, not the sma) is where I would look to scoop this for a long.
Ughh, this is always the most exhausting week of earnings for me to put this report together just because of the sheer number of important earnings reports being released. Really hope that you all can take some serious value from this. These are always nothing more than if/then statements. I don’t have a crystal ball, nor do I need one to make money in the market. I just need to know “if this happens, then I will do this” and my risk management to keep me safe. Period.