There are many free stock charts available on the internet for you to practice on before starting to day trade. It is essential to know how to read charts and be able to use their features and tools.
Day trading is to buy or sell any type of assets on the market during a trading day. A trading day is defined by the marketplace. For example, the New York Stock Exchange opens at 9:30 am and closes at 4:00 pm, Monday through Friday.
Before day trading you must be aware of how these fast-moving markets work and how to correctly analyze a chart in order to determine your next move.
Charts are set up in different ways, but the most popular types are candlestick, linear, and bar charts. Each one will show the rise, fall, and trends of the asset, but the line chart does not show the market’s open value like the candle or bar chart.
Charts have different features, and it is important to understand which of these will help you make better trades. You can watch indicators, time frames, news, social media, and periods.
1. TradingView

TradingView is a beautiful platform for traders who need to take a look at different tickers in real-time. To get access to real-time data, you’ll need to sign up for a paid account — free accounts only have access to a delayed market feed. You may also interact or learn from others as it also includes social media and chat.
You can view all the market quotes on your desktop. There are also charts on forex, futures, cryptocurrencies, indices, stocks, bonds, CFD markets, and world economic data.
Their main features include alerts, filters, enhanced watchlists, and real-time news in order to stay on top of current market results.
TradingView charts allow you to choose how you visualize the market. It allows you to pick between 12 chart types such as candle, bar, line charts, and others.
You can also upgrade to a paid account with a monthly or annual fee. TradingView offers the Pro, pro+, and Premium account depending on your needs and level of trading.
2. Yahoo! Finance
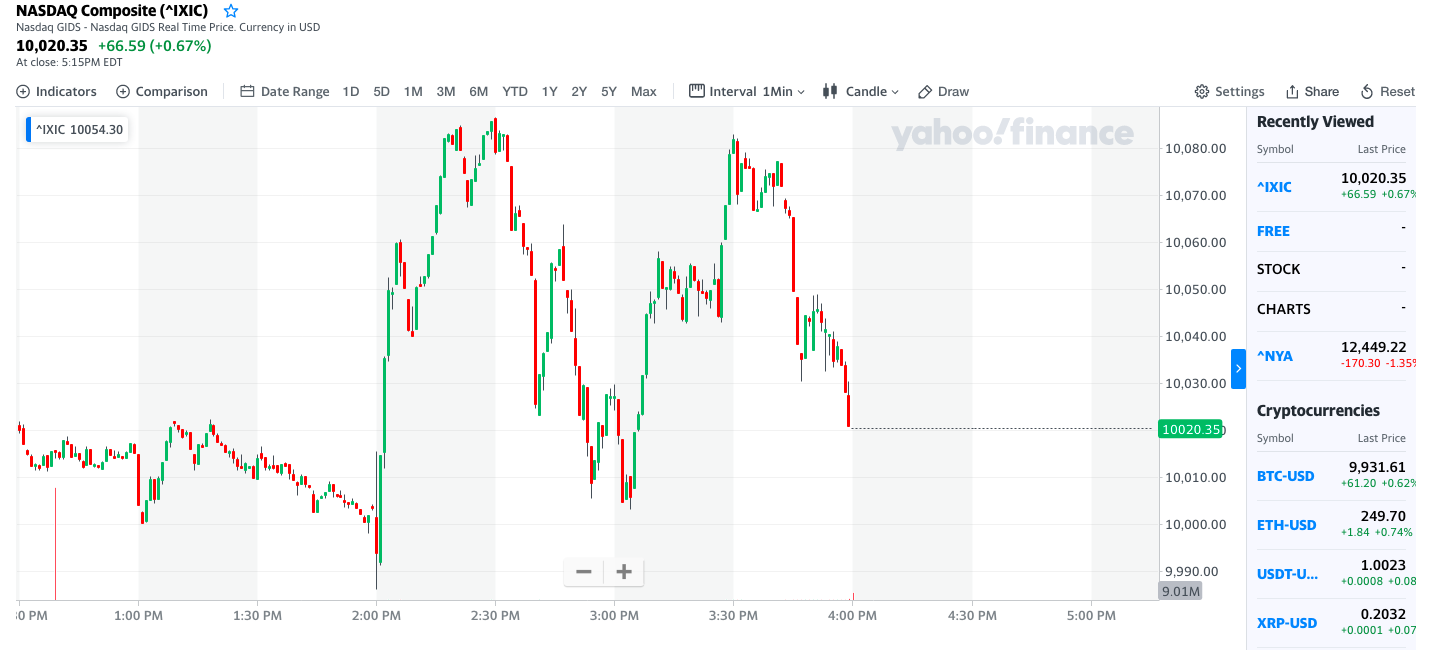
Yahoo Finance has free stock charts and quotes on the NASDAQ, New York Stock Exchange. However, the data on Yahoo Finance is slightly delayed. You can choose between line, area, candle, or bars to visualize a chart and compare it to others.
You can change the interval from one minute up to one year, or manually select a date range to up to five years. They offer over 100 technical tools such as oscillators, moving averages, bollinger bands, MACD, and RSI.
Yahoo Finance allows you to follow stocks, and share charts, as a way to interact with other traders. They also feature a live news section for you to stay informed on all of the latest developments.
If you want to view other quotes or stocks, you have to sign up for the paid version that offers an initial trial. This version will have advanced features such as portfolio analytics, live chat, daily trade ideas, and more.
3. StockCharts
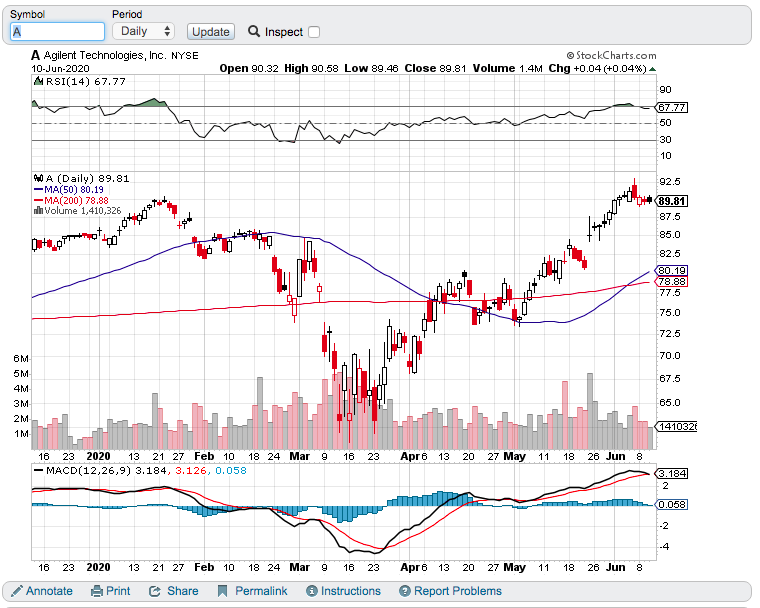
The StockCharts free version includes a number of different charts where you can type in the symbol and see the data in the form of sharpcharts, point and figure, seasonality, candle view, RRG charts, and others.
You can see at the market movements in a daily or weekly period, and modify the color, size, or chart overlays. You can also look at symbol summaries that show the previous close, the all-time high, and a 52-week range.
Don’t forget to look at the news section to find out what is happening around the world and how that could affect the market.
StockCharts offers technical tools to work and experiment with. Some of them are standard deviation, dividends, MACD histogram,stochastics RSI, TRIX, and ulcer index.
If you would like to sign up for the upgraded version in order to get additional features such as customer scans and alerts, you can start with a one month free trial.
4. Finviz
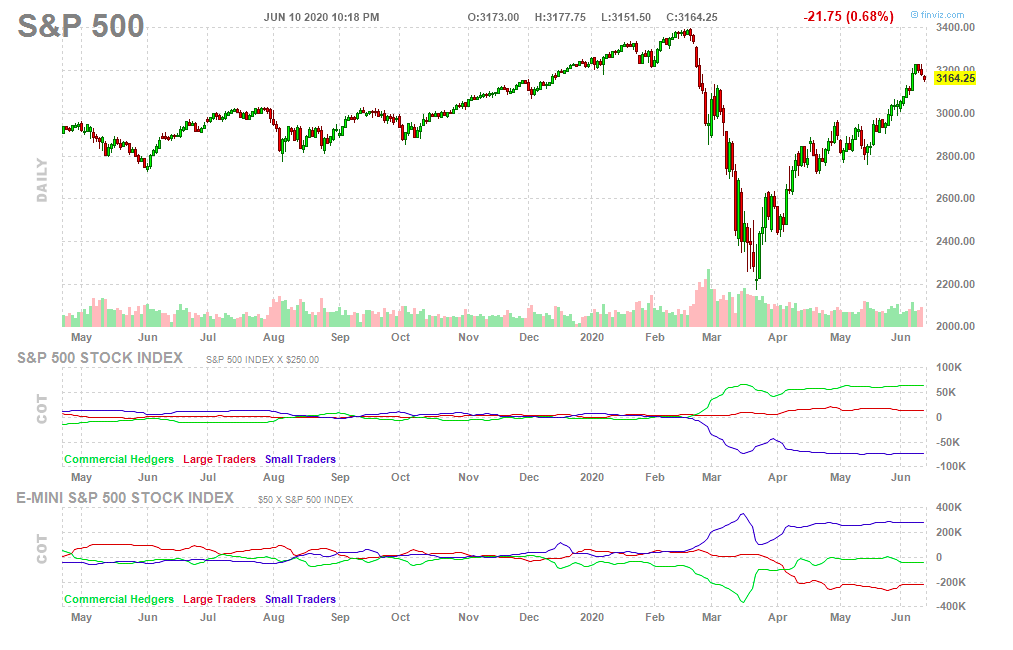
Finviz is another free online stock chart that immediately offers good visualization. Their website includes news as well as a special blog section organized by the time of publication.
One of their features is an interesting heat map that is set up in areas such as healthcare, financial, or communications. You can visualize assets on a chart for forex, futures, and cryptocurrency.
There is no access to features or technical tools in the free version, and you can only view daily, weekly, and monthly timeframes.
The quotes, charts, and screening are delayed on the free version, and you will not be allowed to export results. If you would like free live stock charts, or other tools and features, you must sign up for the paid version.
5. Barchart
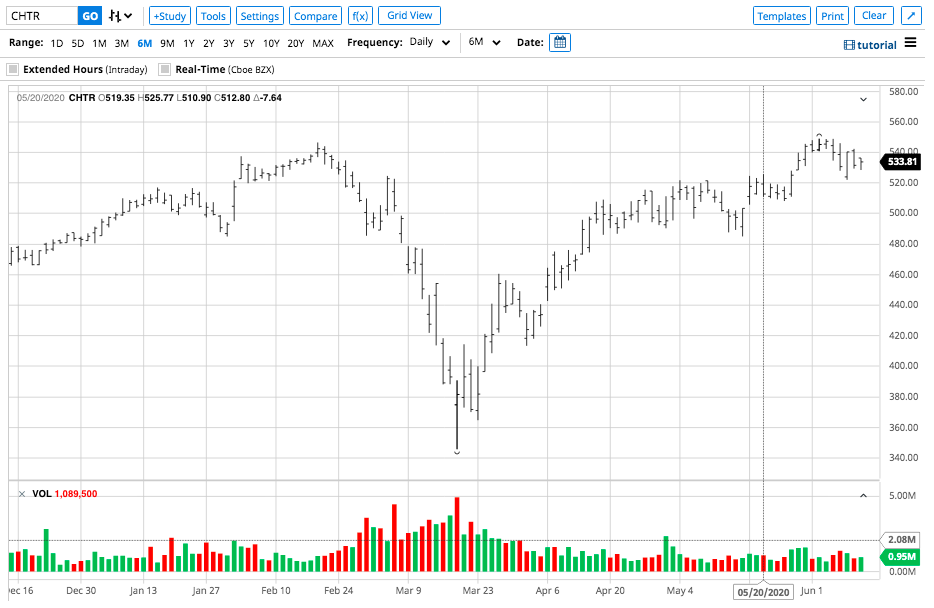
Barchart has various helpful services like charts, news, articles, screeners, and an educational section.
The free stock market charts do not offer quotes in real-time. It does allow you to save your screens, share them on social media, and personalize your watchlist.
Barchart has technical tools such as linear regression channel, moving average, ichimoku clouds, super trend, ranges, oscillators, and many others.
You may edit your chart template choosing 10 different chart bars, chart size, scale, price label, and grids. If you need to draw over your chart or add a symbol, you may on the free version.
For the paid version, you will be able to see up to four different symbols on one single chart. You will have full access to the stocks, ETFs, currencies, cryptocurrencies, and mutual funds with the Premier account.
6. Fidelity
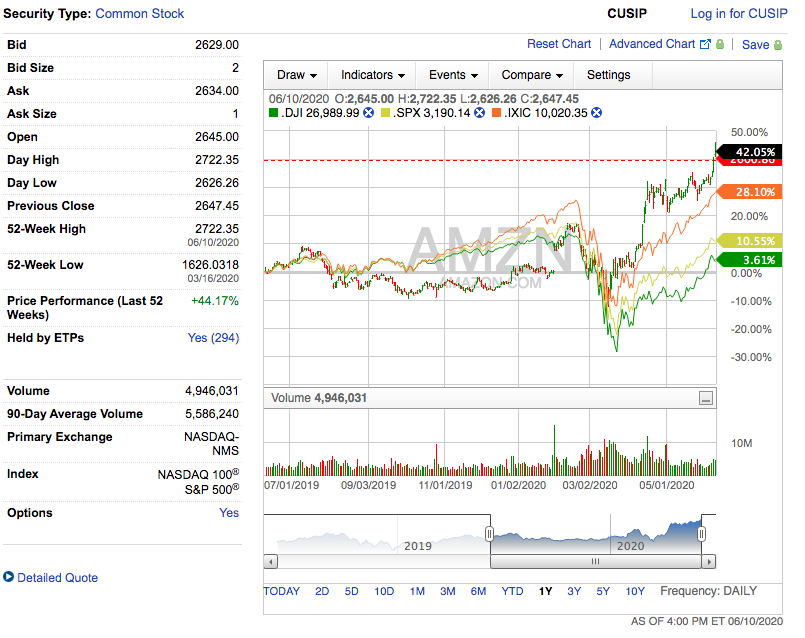
Fidelity is on our list of the best stock charts because you can visualize up to 10 different symbols on the free version. You can also draw, and change the chart type to mountain, OHLC, candlestick and linear.
The Fidelity charting software platform will let you hide or show extended and previous close hours. It is important to mention that they offer a news and research section as well.
To use any sort of tool or set an alert, you need to create an account with a broker. Fidelity also offers educational webinar notifications, key statistics, detailed quotes, and more.
Choosing the Best Free Stock Charts in the Market
We’ve explained these free day trading stock charts so you can find the best option for your needs and preferences. Remember to carefully review all of the features and tools they offer to find the right resource.
Charts will help you find the fundamental information in order to plan an effective strategy before you start to day trade actively.